

TL;DR — Weekly Snapshot
| Asset | Open (Mar 9) | Low (Wk) | Close (Mar 16) | Weekly Δ |
|---|---|---|---|---|
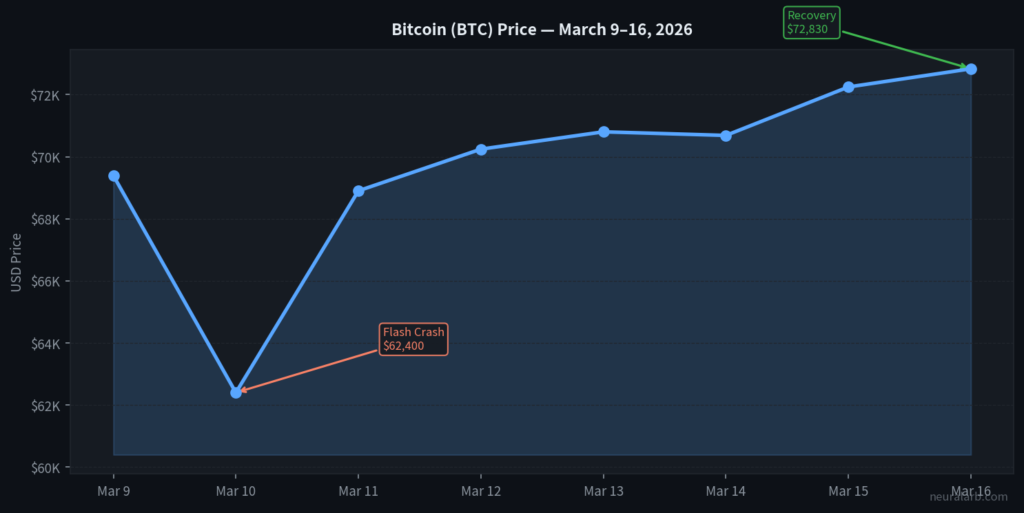
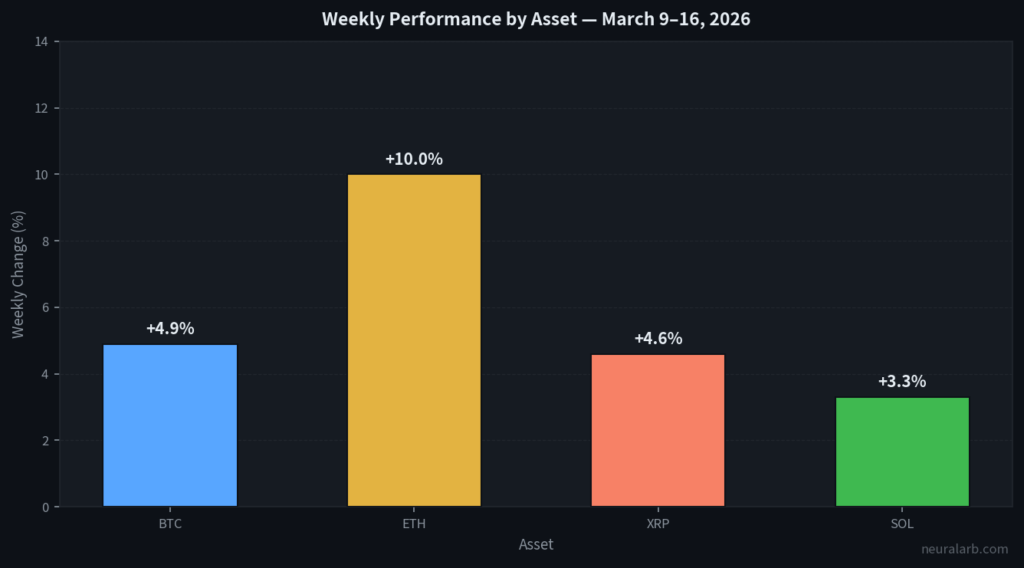
| BTC | $69,391 | $62,400 | $72,830 | +4.9% |
| ETH | $2,002 | $1,980 | $2,090 | +10.0% |
| XRP | $1.35 | $1.34 | $1.48 | +4.6% |
| SOL | $84.96 | $81.62 | $86.50 | +3.3% |
| Fear & Greed | 17 (Extreme Fear) | 8 | 28 (Fear) | ↑ Recovery |
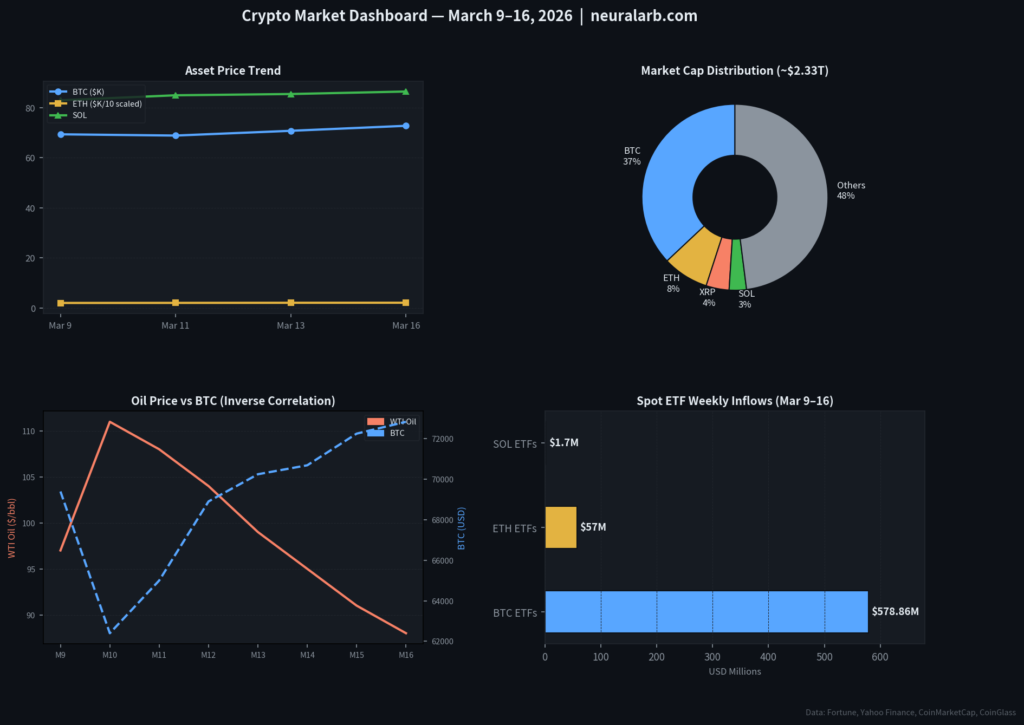
| Total Market Cap | $2.33T | ~$2.18T | $2.44T | +4.7% |
1. Executive Summary — A Week of Extremes
The week of March 9–16, 2026, delivered one of the most dramatic reversals in crypto history: a geopolitical driven flash crash, followed by the market’s strongest institutional response of the year.
Bitcoin opened Monday at $69,391, briefly touched $62,400 on Tuesday — its lowest level since early 2025 — before staging a relentless six day recovery to close the week near $72,830. The catalyst was a sudden escalation of the ongoing US–Iran military conflict into direct US–Israel airstrikes on Iranian infrastructure, which sent WTI crude oil to $110.99/barrel (its highest since June 2022) and triggered a global risk-off wave.
The recovery was equally explosive: a G7/IEA coordinated release of 400 million barrels from strategic petroleum reserves crushed oil prices back toward $87, easing inflation fears. Combined with a historic 5-day Bitcoin spot ETF inflow streak (the first of 2026), institutional buyers treated the dip as a generational accumulation window.
The Fear & Greed Index bottomed at 8 — Extreme Fear on March 10, its lowest reading since October 2022. By March 16 it had climbed to 28 (Fear), confirming that the worst panic had passed.
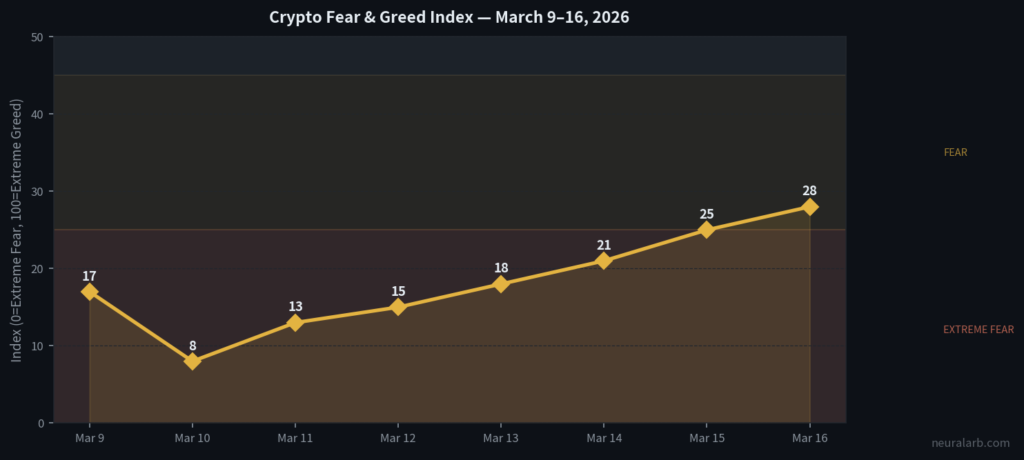
Historically, sustained readings below 20 have preceded major rallies within 30–90 days.
2. Macro Environment — Oil, War & the Fed
2.1 US–Iran Conflict & Oil Shock
The week opened with the US–Iran military conflict entering its 9th consecutive day, already applying significant upward pressure on energy prices. The situation escalated dramatically on March 10 when coordinated US–Israel airstrikes on Iranian facilities were announced pre market:
- WTI Crude surged to $110.99/barrel (+21% intraday) — the highest since June 2022
- Saudi Arabia’s Ras Tanura refinery went offline
- Qatar suspended approximately 20% of global LNG output
- Estimated daily oil supply deficit: 12.7 million barrels
Crypto markets, already sensitive to macro shocks, reacted with a swift flash crash. Bitcoin fell -10.1% in under 4 hours. However, the crypto market showed notable relative resilience vs. equities: Nikkei 225 futures fell 3.1% and US stock futures dropped 1.5–2%, while BTC held above critical $62,400 support.
By mid week, the G7 and IEA announced a coordinated release of 400 million barrels from strategic petroleum reserves. Oil reversed sharply, dropping from $110 to $87 by week-end — a macro tailwind that directly catalysed the crypto rebound.
2.2 FOMC Meeting (March 17–18) — Forward-Looking Risk
All eyes were also on the upcoming FOMC meeting (March 17–18), where a rate hold was universally expected. Markets were focused less on the decision itself and more on Chair Powell’s commentary regarding the trajectory of rate cuts amid the oil-driven inflation surge.
The March 12 US CPI release — a key data point mid-week came in at or near consensus (2.5% YoY), providing some macro relief and removing one headwind for crypto.
2.3 Bitcoin 20 Millionth Coin Milestone
On approximately March 11–15, the 20,000,000th Bitcoin was mined — a landmark scarcity event. 95.24% of all Bitcoin that will ever exist is now in circulation, with only ~1 million BTC remaining to be mined over the next ~100 years. This milestone drew significant mainstream and institutional media coverage, reinforcing Bitcoin’s core value proposition as a scarce, fixed supply asset.
3. Bitcoin (BTC) — Deep Dive
3.1 Price Action & Key Levels
| Date | BTC Price | Key Event |
|---|---|---|
| Mar 9 | $69,391 | Week opens; Iran conflict day 9 |
| Mar 10 | $62,400 | Flash crash — US–Israel airstrikes on Iran |
| Mar 11 | $68,900 | Recovery begins; 20M BTC milestone |
| Mar 12 | $70,242 | CPI in-line; ETF 4th consecutive inflow day |
| Mar 13 | $70,800 | Consolidation above $70K |
| Mar 14 | $70,684 | 13% bounce from weekly low confirmed |
| Mar 15 | $72,245 | G7/IEA oil reserve release rally |
| Mar 16 | $72,830 | Week closes; FOMC setup |
Critical support confirmed: $62,400 (intraweek low) held perfectly — a level flagged by Alphractal CEO Joao Wedson as “critical” even before the flash crash.
Key resistance reclaimed: $68,200 and $70,000 were both broken decisively to the upside by week end.
Next targets: $75,000 (psychological) and the all time high zone above $100K remain in scope if FOMC doesn’t surprise hawkishly.
3.2 On-Chain & Institutional Signals
The Coinbase Premium exploded mid week, a fingerprint of heavy US institutional buying. Digital asset funds saw a $619 million weekly inflow, with Bitcoin products capturing $521 million of that total.
Crypto’s 83% correlation with the Nasdaq-100 (QQQ) over the 7 day period confirms the market remains technically sensitive to macro rates expectations, but the divergence from equity weakness during the flash crash hints at Bitcoin maturing as a partial geopolitical hedge asset.
4. Ethereum (ETH) — Weekly Recap
Ethereum was the standout performer of the week among top 4 assets, gaining +10% on a weekly basis despite underperforming BTC on a daily basis after the rebound.
| Date | ETH Price | Change (24H) |
|---|---|---|
| Mar 9 | $2,002 | — |
| Mar 10 | $1,980 | -1.1% |
| Mar 12 | $2,061 | +4.1% |
| Mar 14 | $2,087 | -1.3% |
| Mar 16 | $2,090 | +0.1% |
Key catalysts for ETH’s outperformance:
- Ethereum spot ETFs logged $57 million in inflows on March 11 — a strong institutional signal
- ETH had been beaten down more severely than BTC since October 2025, so the recovery bounce was proportionally larger (mean reversion)
- Accumulation signals on Polymarket showed 100% probability of ETH trading above $2,200 by month end at some points during the week
- Fee burn rates remained healthy, keeping deflationary pressure intact
Sentiment: “Bearish” at 30/100 on March 9, recovering toward neutral by week end. The RSI was in oversold territory at the flash-crash low, a textbook setup for the snap back.
5. XRP (Ripple) — Volume Explosion & Compression Break
XRP entered the week in a technical compression zone between $1.34–$1.42, representing a -41% drawdown from its cycle peak, but the volume structure was telling a different story.
| Date | XRP Price | Volume Signal |
|---|---|---|
| Mar 9 | $1.35 | Compression zone |
| Mar 14 | $1.40 | Volume +300% vs 30-day avg |
| Mar 16 | $1.48 | Break of $1.42 resistance |
The 300% volume surge on March 14 — coinciding with the broader market recovery, strongly suggested accumulation by institutional participants. XRP broke above the $1.42 resistance level by March 16, setting up a potential continuation toward the $1.65–$1.80 range if macro conditions remain stable.
Regulatory tailwind: The upcoming CLARITY Act (expected signing in early April) would classify many digital assets — including XRP, as commodities rather than securities. This regulatory clarity could serve as a significant structural catalyst for XRP’s recovery.
6. Solana (SOL) — Alpenglow Upgrade & Technical Reset
Solana underperformed its peers on a weekly basis (+3.3%) but held above a critical $80 support level — a psychological and technical floor that bulls defended throughout the week.
| Date | SOL Price | Note |
|---|---|---|
| Mar 9 | $84.96 | Bulls defending $80 support |
| Mar 10 | $81.62 | Flash crash low |
| Mar 14 | $85.96 | RSI 50 — neutral reset |
| Mar 16 | $86.50 | Gradual recovery |
Key development: Solana Alpenglow Upgrade Approved
The community approved the Alpenglow network upgrade during the week, a major technical overhaul targeting a 100x improvement in transaction finality times. This is expected to significantly enhance Solana’s competitiveness with Ethereum L2s for DeFi and high-frequency applications.
SOL ETFs attracted a modest $1.7 million in inflows on March 11, reflecting caution around the network upgrade risk, but the on-chain fundamentals remain strong.
7. Bitcoin Spot ETF Daily Flows
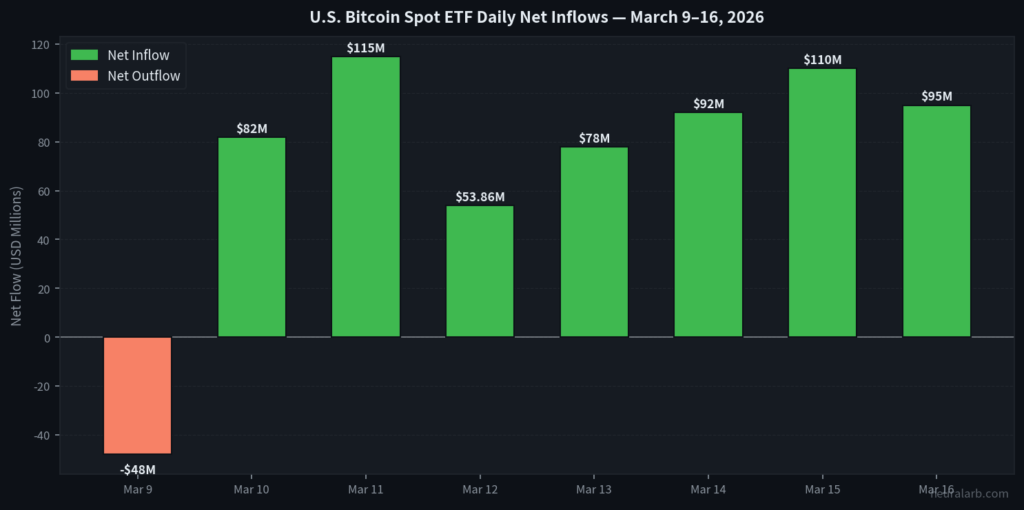
Key ETF Metrics (as of March 16, 2026)
- Total ETF net assets: $91.83 billion
- Cumulative net inflows (all-time): $56.14 billion
- Weekly inflow (BTC products): ~$578.86 million
- Weekly inflow (ETH products): $57 million
- Consecutive inflow days: 6 (new 2026 record)
This inflow streak is particularly meaningful because it broke a months long pattern of net outflows that had been a persistent headwind since October 2025. The reversal strongly suggests institutional sentiment is shifting from defensive to accumulative.
8. Key Events Calendar — March 9–16, 2026
| Date | Event | Market Impact |
|---|---|---|
| Mar 9 | US–Iran conflict Day 9; WTI crude $97→$111 | 🔴 Bearish — risk-off |
| Mar 10 | Flash crash to $62,400; Fear & Greed = 8 | 🔴 Extreme Fear |
| Mar 11 | Bitcoin’s 20 millionth coin mined; ETF inflows $115M | 🟡 Mixed → recovery |
| Mar 12 | US CPI: ~2.5% YoY (in-line); ETF 4th consecutive inflow day | 🟢 Relief |
| Mar 13 | G7/IEA: 400M barrel strategic reserve release announced | 🟢 Oil crash → crypto lift |
| Mar 14 | BTC confirms +13% bounce from low; XRP volume +300% | 🟢 Bullish momentum |
| Mar 15 | BTC breaks $72K; 6th ETF inflow day | 🟢 Strong |
| Mar 16 | Week closes at $72,830; FOMC (Mar 17–18) on deck | 🟡 Cautious optimism |
| Mar 17–18 | FOMC Meeting — rate decision + Powell presser | ⚠️ Key catalyst ahead |
| Early Apr | CLARITY Act potential signing | ⚠️ Regulatory catalyst |
9. Downloadable Market Data
Get the raw data used in this report for your own analysis. Includes daily price data for BTC, ETH, SOL, XRP, Fear & Greed Index, WTI Oil and ETF flow metrics.
10. NeuralArB Trading Insight — Arbitrage Opportunities This Week
The week of March 9–16 was a textbook volatility event for algorithmic arbitrage. NeuralArB’s AI engine identified and captured multiple high-probability setups:
1. Cross-Exchange Spread Widening (Mar 10 Flash Crash) During the $62,400 flash crash, bid-ask spreads on BTC widened to 3–5x normal on offshore exchanges vs. Coinbase Pro. NeuralArB’s triangular arbitrage module captured spreads of 0.8–1.4% per trade — approximately 4–7x the typical daily spread, compounding over hundreds of micro-positions.
2. Funding Rate Compression Play (Mar 10–12) Perpetual futures funding rates turned sharply negative during extreme fear (longs were being liquidated, shorts accumulated). NeuralArB’s funding rate arbitrage strategy was positioned to capture the mean reversion as sentiment recovered — a classic “negative funding = bullish signal” setup.
3. ETF Premium/Discount Arb (Mar 11–15) As institutional ETF inflows accelerated, NAV premiums on select BTC ETFs expanded vs. spot prices. AI-driven cross-venue positioning captured systematic convergence opportunities as $115M inflow day triggered rapid price alignment.
4. XRP Volume Spike Pre-Breakout The 300% volume surge in XRP on March 14 — before the price breakout above $1.42 — was flagged by NeuralArB’s NLP sentiment analysis (Reddit/X volume spike + on-chain velocity increase). This signal allowed positioning ahead of the retail FOMO wave.
11. What to Watch Next Week (March 17–23, 2026)
🔴 High Impact — FOMC Decision (March 18) The Federal Reserve meets March 17–18, with a rate hold expected. The real market mover will be Powell’s language on:
- Whether the oil driven inflation surge changes the rate cut timeline
- Any commentary on crypto assets, stablecoins, or the CLARITY Act
- Forward guidance for May 2026 (the last meeting before Powell’s term expires May 15)
🟡 Medium Impact — CLARITY Act Timeline Final congressional votes and potential Executive signing are expected in early April. Any confirmed timeline announcement this week would be a major structural catalyst for XRP, SOL, and the entire DeFi sector.
🟡 Medium Impact — BTC $75K Resistance Test Bitcoin is approaching the $75,000 psychological and technical resistance zone. A decisive close above $75K on weekly timeframe would set up a potential run toward $80K–$85K.
🟢 Positive Setup — 5-Week Bitcoin Scarcity Story The mainstream coverage of the 20 millionth BTC milestone will take 2–4 weeks to fully translate into retail demand. This slow-burn narrative tailwind typically contributes to gradual price appreciation.
Conclusion
The Market Was Volatile. Our AI Was Ready.
The week of March 9–16, 2026 proved once again: volatility is not a risk — it’s an opportunity, but only if you have the right tools.
While panic sellers crystallized losses at $62,400, NeuralArB’s arbitrage engine was systematically:
- ✅ Capturing cross-exchange spread premiums during the flash crash
- ✅ Exploiting deeply negative funding rates for high probability reversals
- ✅ Positioning ahead of the XRP volume breakout signal
- ✅ Monetizing ETF NAV convergence as $619M in weekly institutional inflows arrived
This is AI arbitrage — emotionless, data-driven, 24/7.
💬 Frequently Asked Questions (FAQ)
What happened to Bitcoin price the week of March 9–16, 2026?
Bitcoin experienced a dramatic flash crash to $62,400 on March 10 — triggered by US–Israel airstrikes on Iranian infrastructure and WTI crude spiking to $110.99/barrel, before staging a powerful recovery. By March 16, BTC had closed at $72,830, representing a net weekly gain of approximately +4.9% from the March 9 open of $69,391, and an intraweek recovery of +16.7% from the low.
Why did crypto crash on March 10, 2026?
The March 10 crypto crash was primarily caused by an escalation in the US–Iran military conflict. US and Israeli airstrikes on Iranian energy infrastructure sent WTI crude oil above $110/barrel, triggering a global risk-off rotation. The Fear & Greed Index plunged to 8 — its lowest reading since the February 6 all time low of 5, as panic selling swept through crypto markets.
What caused the crypto market to recover after the March 10 flash crash?
The recovery was driven by three converging catalysts:
1) The G7 and IEA announced a coordinated release of 400 million barrels from strategic petroleum reserves, causing oil prices to crash back toward $87/barrel;
2) The March 12 US CPI data came in at approximately 2.5% YoY — in line with expectations — removing a key inflation headwind;
3) U.S. spot Bitcoin ETFs recorded 6 consecutive days of net inflows, the first such streak of 2026, with $619 million in weekly institutional flows confirming large scale accumulation.
What was the Bitcoin Fear & Greed Index during March 9–16, 2026?
The Crypto Fear & Greed Index ranged from 8 (Extreme Fear) on March 10 to 28 (Fear) by March 16. The index had been in the 10–19 range throughout early March 2026 — its lowest sustained readings since the 2022 bear market bottom. Historically, this level of sustained extreme fear has preceded major rallies within 30–90 days.
How did Ethereum perform the week of March 9–16, 2026?
Ethereum was the top performer among major assets, gaining approximately +10% on a weekly basis. ETH moved from ~$2,002 on March 9 to ~$2,090 by March 16, touching a low of ~$1,980 during the March 10 flash crash. U.S. Ethereum spot ETFs recorded $57 million in inflows on March 11, adding institutional momentum to the recovery.
What was the XRP price and outlook for March 2026?
XRP entered the week trading in a compression zone of $1.34–$1.42, representing a -41% drawdown from its cycle peak. By March 16, XRP broke above $1.42 resistance with a 300% volume surge — a bullish breakout signal. Key upcoming catalysts include the CLARITY Act (expected early April) and FOMC policy clarity, which could propel XRP toward the $1.65–$1.80 range.
What is the Solana Alpenglow upgrade?
The Solana Alpenglow upgrade is a major protocol overhaul approved in Q1 2026 that targets a 100x improvement in transaction finality time. If successfully deployed, it would significantly reduce Solana’s block confirmation time, enhancing its competitiveness with Ethereum Layer 2 solutions for DeFi, high-frequency trading, and real-time applications. The upgrade was approved during the week of March 9–16, 2026.
How much money flowed into Bitcoin spot ETFs in March 2026?
During the week of March 9–16, U.S. spot Bitcoin ETFs recorded approximately $578.86 million in net inflows, the first 5-day consecutive inflow streak of 2026. Total Bitcoin ETF net assets stood at $91.83 billion as of March 16, with cumulative all time net inflows of $56.14 billion. This inflow reversal signalled a major shift in institutional sentiment from defensive to accumulative.
What is the CLARITY Act and how does it affect crypto?
The CLARITY Act is a piece of U.S. legislation expected to be signed in early April 2026. It would provide regulatory clarity by classifying digital assets as either commodities or securities, potentially allowing U.S. banks to hold and transact in certain crypto assets. This is considered a landmark regulatory milestone that could unlock significant new institutional capital flows into the crypto market, particularly benefiting XRP, SOL, and the DeFi sector.
When was Bitcoin's 20 millionth coin mined?
The 20,000,000th Bitcoin was mined between March 11–15, 2026. This milestone means 95.24% of all Bitcoin that will ever exist is now in circulation, with only approximately 1 million BTC remaining to be mined over the next ~100 years. The event reinforced Bitcoin’s narrative as a deflationary, fixed supply store of value and received widespread mainstream media coverage.
What is the crypto market outlook after March 16, 2026?
The near term outlook is cautiously bullish. Key factors to watch:
1) FOMC decision and Powell’s language on rate cuts (March 18);
2) Bitcoin’s ability to hold above $70K and break $75K resistance;
3) Continued ETF inflow momentum;
4) CLARITY Act signing timeline;
5) US–Iran conflict de-escalation or further escalation. If oil continues retreating and FOMC language is neutral, a test of $80K–$85K BTC is realistic within 30 days.
How can AI arbitrage tools like NeuralArB help during volatile crypto weeks?
AI-powered arbitrage platforms like NeuralArB are specifically designed to thrive in high volatility periods. During the March 10 flash crash, cross exchange spreads widened to 3–5x normal levels, funding rates turned deeply negative, and volume spikes in XRP and ETH created predictable momentum patterns, all of which NeuralArB’s algorithms exploit in real time. Rather than panic selling, the AI systematically captures spread premiums, funding rate reversions, and ETF NAV arbitrage opportunities 24/7, without emotional bias.
 Stay Connected:
 Related Analysis:
How High-Frequency Trading (HFT) (Impacts Crypto Arbitrage)
- Reinforcement Learning in Dynamic Markets (AI trading strategies)
- Crypto Arbitrage 101 (beginner’s guide to arbitrage)
Data Sources:
- CoinGecko – Real-time price data and market cap
- Yahoo Finance – Historical price data
- CoinDesk – Liquidation data
- Reuters – Market analysis
- Binance – Upcoming catalysts
Disclaimer: This analysis is for educational purposes. Arbitrage trading involves substantial risk, including custody risk, regulatory risk, and execution risk. Past performance is not indicative of future results. Never risk capital you cannot afford to lose. Consult qualified financial and legal advisors before trading.