

Crypto Market Update – March 2–10, 2026: BTC $72K, Extreme Fear & Arbitrage Signals

Crypto Market Update March 2-10

Executive Summary


The first week of March 2026 has been defined by extreme volatility, with Bitcoin (BTC) surging to a mid week high of $72,400 before retracing sharply to the $67,000 range. This rollercoaster price action has been driven by a complex mix of geopolitical tensions (US-Iran), fluctuating ETF flows, and the upcoming “20 Millionth Bitcoin” milestone. Ethereum (ETH) continues to struggle, breaking below the psychological $2,000 support level, while altcoins like XRP and Solana face significant headwinds. Institutional sentiment has shifted rapidly from greed to “Extreme Fear” (18/100), creating a unique environment for arbitrage strategies. This report breaks down the critical data points, technical levels, and AI-driven arbitrage opportunities that defined the market between March 2 and March 10, 2026.


1. Market Overview: The Week That Shook Crypto


The crypto market experienced one of its most volatile weeks in 2026 between March 2 and March 10. Total market capitalization dropped from a high of $2.56 trillion on March 5 to approximately $2.21 trillion by March 10, wiping out over $350 billion in value in just five days. This swift reversal underscores the fragility of the current market structure, which remains heavily dependent on macroeconomic signals and geopolitical stability.


The week began with optimism as Bitcoin reclaimed the $68,000 level on March 2, buoyed by renewed institutional interest and positive ETF inflows. By midweek, specifically March 5, the market appeared poised for a breakout. Bitcoin touched an intraday high of $72,400, and major altcoins like Ethereum, Solana, and XRP posted 8% daily gains. However, this bullish momentum was short lived.


A sudden shift in global risk sentiment, triggered by escalating tensions between the US and Iran, sent shockwaves through risk assets. By March 6, the narrative had flipped entirely. Bitcoin plunged below $71,000, and significant ETF outflows totaling $227.8 million signaled a retreat by institutional investors. The sell off intensified over the weekend, dragging the total crypto market cap down to $2.29 trillion by March 9, with Bitcoin hovering precariously around $67,300.
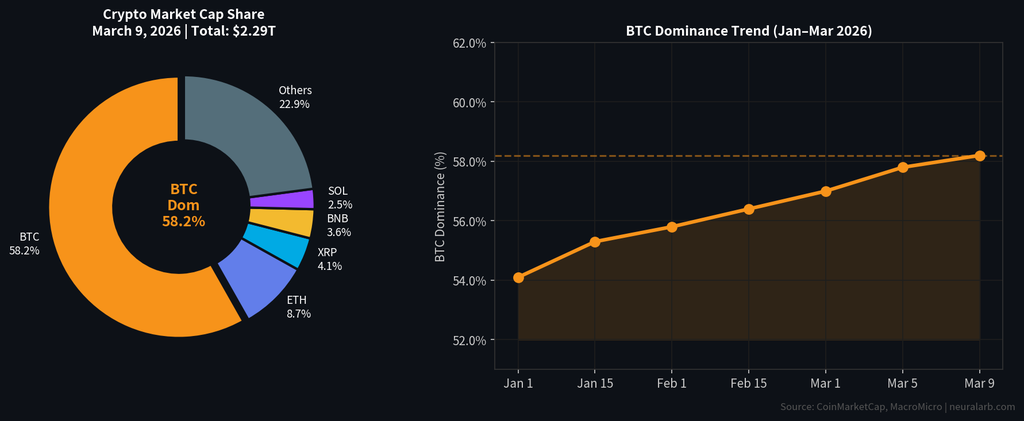
Total Market Cap vs. BTC Dominance (March 2-10, 2026)
Figure 1: Total Market Cap vs. BTC Dominance (March 2-10, 2026). The sharp decline in market cap coincides with rising BTC dominance, indicating a flight to safety within the crypto ecosystem.

Notably, Bitcoin Dominance has been on a steady upward trajectory, rising from 57.1% on March 2 to 58.5% by March 10. This flight to quality within the crypto ecosystem suggests that while investors are fearful, they prefer holding Bitcoin over riskier altcoins during periods of uncertainty. The divergence between Bitcoin’s relative resilience and the broader altcoin market’s weakness is a defining theme of this period, offering distinct opportunities for pairs trading and arbitrage.


2. Bitcoin Analysis: From $72K Highs to $67K Reality


Bitcoin’s price action this week serves as a masterclass in market volatility. The leading cryptocurrency started the week trading at $68,200, finding strong support above the 50 day moving average. The early part of the week was characterized by aggressive buying, driven largely by the “20 Millionth Bitcoin Mined” narrative a scarcity event expected to occur between March 11 and 15.


On March 4, buying pressure intensified, pushing BTC to an intraday high of $71,890. This momentum carried into March 5, where Bitcoin peaked at $72,400. At this level, market sentiment was overwhelmingly bullish, with many analysts predicting a swift move to new all time highs. However, the $72,000 – $74,000 zone proved to be a formidable resistance level once again.

“Bitcoin’s rejection at $72,400 wasn’t just technical; it was a liquidity event. Over $220 million in long positions were liquidated in less than 4 hours on March 6.”

The reversal began on March 6, coinciding with a broader risk off move in global markets. Bitcoin shed over $1,500 in hours, closing the day near $70,500. The selling pressure continued through the weekend, a time typically characterized by lower liquidity and higher volatility. By March 9, BTC had retraced to $67,337, effectively erasing the gains from the midweek rally.
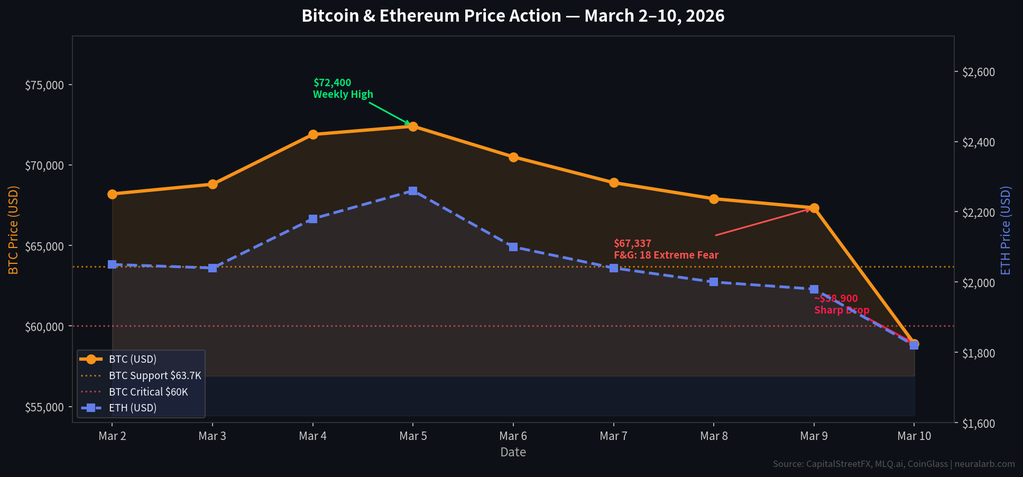
BTC & ETH Price Action March 2–10, 2026
Figure 2: Bitcoin and Ethereum Price Action (March 2-10, 2026). Note the divergence as BTC holds relative strength while ETH makes lower lows.

As of early March 10, prediction markets on platforms like Robinhood are pricing Bitcoin in the $58,500 – $59,000 range, indicating extreme bearish sentiment has taken hold. This drastic drop represents a critical test of the $60,000 psychological support. If this level fails to hold, technical analysis suggests a potential slide toward the $52,000 region. Conversely, a bounce here could confirm a higher low on the weekly timeframe, keeping the long term bullish structure intact.

Capitalize on Volatility


Discover how NeuralArB’s AI-powered bots captured 2.4% arbitrage spreads during this week’s volatility. Don’t just watch the market move profit from it.


3. Ethereum’s Struggle: Breaking Down Below $2,000


While Bitcoin has managed to retain some of its value relative to its highs, Ethereum (ETH) has faced a much more challenging environment. The second largest cryptocurrency by market capitalization began the week trading at $2,050, struggling to gain momentum despite the broader market rally.


Ethereum’s weakness is structural. The ETH/BTC ratio has continued to bleed, hitting multi year lows. Even during the midweek rally on March 5, where ETH briefly surged to $2,260, it failed to sustain these levels. The subsequent rejection was swift and brutal. By March 8, Ethereum had broken below the critical psychological support of $2,000, trading at $1,980.


By March 10, ETH had slid further to $1,820, a level not seen since late 2024. Several factors are contributing to this underperformance:


    • Lack of Institutional Flows: Unlike Bitcoin, which has seen substantial ETF inflows, Ethereum spot ETFs have seen muted interest, with net outflows recorded on multiple days this week.
    • L2 Fragmentation: Liquidity continues to fragment across various Layer 2 solutions, diluting the value accrual to the mainnet asset.
    • Regulatory Uncertainty: Renewed scrutiny on Proof-of-Stake assets by global regulators has dampened sentiment.

The upcoming “Glamsterdam” upgrade, slated for H1 2026, promises to address some scalability issues, but the market seems unwilling to price in this future catalyst just yet. For now, ETH remains in a precarious position, with bears eyeing the $1,750 support zone as the next target.


4. Altcoin Performance: XRP, Solana, and BNB in Focus


The Altcoin Season narrative took a significant hit this week as liquidity drained from mid and low cap assets back into Bitcoin and stablecoins. However, specific assets showed idiosyncratic price action driven by ecosystem specific developments.


XRP: Volatility Amidst ETF Outflows


XRP started the week strong at $1.62 and rallied to $1.74 on March 5. However, it faced significant headwinds from ETF outflows, with over $22 million exiting XRP investment products in just two days (March 6-7). By March 10, XRP had retraced to $1.38. Despite this, the community remains optimistic about a $1.50 target, contingent on a broader market recovery.


Solana (SOL): Upgrade Success vs. Price Decline


Solana’s fundamental narrative remains strong. This week saw the successful approval of the Alpenglow upgrade, with 98.27% of stakers voting in favor. This upgrade is set to reduce finality times to 100-150ms, a massive technical achievement. Price wise, however, SOL was not immune to the market downturn. From a high of $90.10 on March 5, it dropped to $80.20 by March 10. The $80 level is a critical support zone for bulls to defend.


BNB: Relative Stability


Binance Coin (BNB) exhibited its trademark resilience, trading in a relatively tight range between $620 and $651. Closing the week at roughly $634, BNB continues to act as a defensive asset within the altcoin sector, outperforming both ETH and SOL on a relative basis.
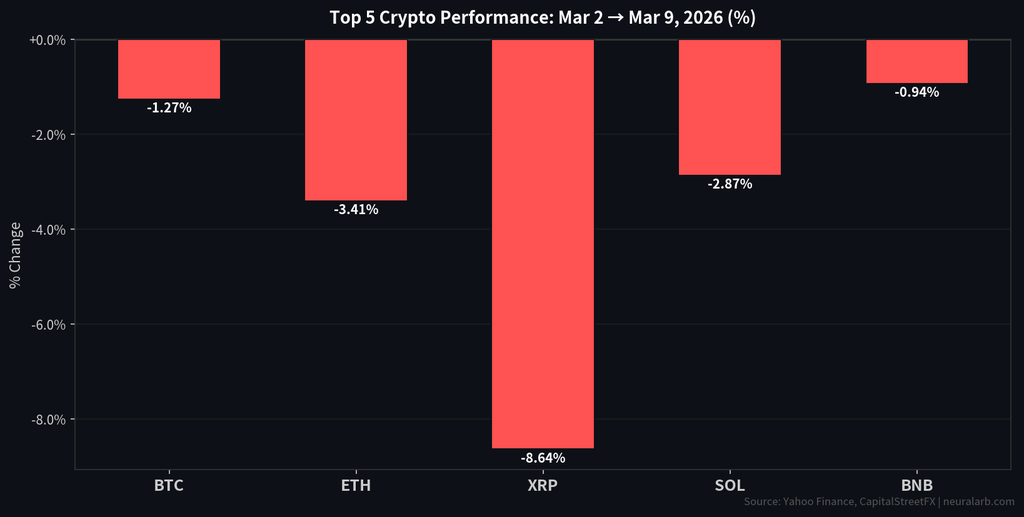
Altcoin Performance (XRP, SOL, BNB) March 2026
Figure 3: Relative Performance of XRP, Solana, and BNB (Rebased to 100). Solana showed the highest volatility, while BNB remained the most stable.


5. ETF Flows: The Institutional Money Story


Institutional flows through US Spot ETFs continue to be a primary driver of Bitcoin’s short term price action. The week began with a massive vote of confidence; on March 2, Bitcoin ETFs recorded $521 million in net inflows, led predominantly by BlackRock‘s IBIT fund.


This buying spree continued through March 4, culminating in a 5-day cumulative inflow of over $1.4 billion. This capital injection was the fuel behind Bitcoin’s run to $72,400. However, the sentiment flipped as quickly as it had arrived. On March 6, the market saw net outflows of $227.83 million, with BlackRock’s IBIT alone seeing nearly $89 million in redemptions.
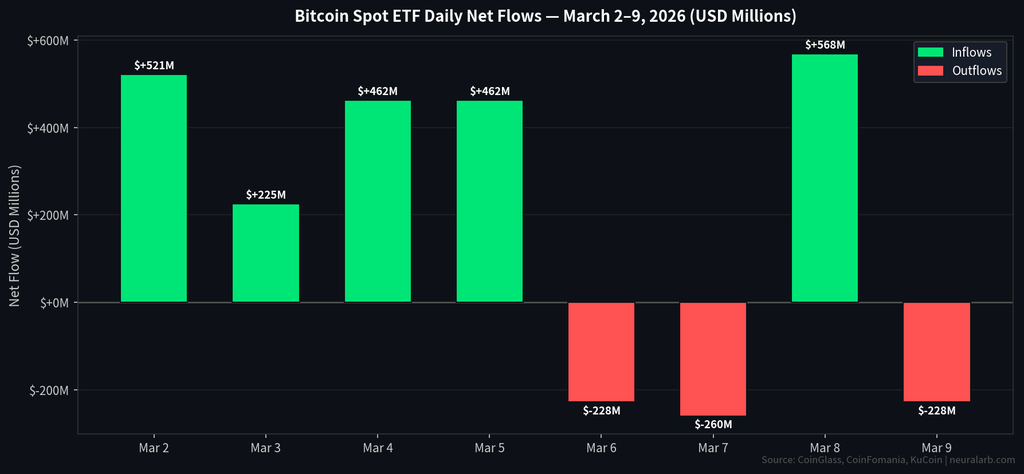
Bitcoin Spot ETF
Figure 4: Daily Net Flows for US Spot Bitcoin ETFs (USD Millions). The sharp reversal from inflows to outflows on March 6 marks the local top for BTC price.

This “hot and cold” behavior from institutional investors suggests a tactical approach to the current market environment. Institutions are happy to ride momentum but are quick to de risk at the first sign of geopolitical trouble or technical weakness. Monitoring daily ETF flow data has become essential for short term trading strategies.


6. Market Sentiment: Extreme Fear Grips Traders


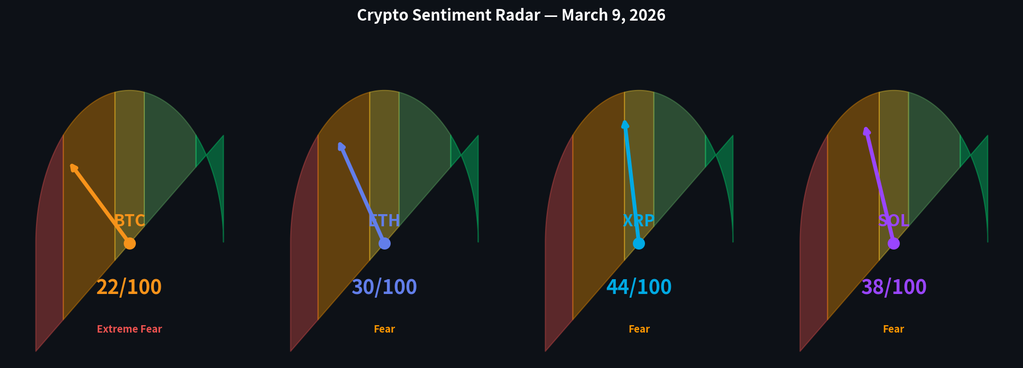
Market sentiment is perhaps the most telling indicator of the current environment. The Crypto Fear & Greed Index, a popular metric for gauging market emotion, plummeted to 18/100 (Extreme Fear) by March 9. This is the lowest sustained reading since the bottom of the 2022 bear market.
Crypto Fear & Greed Index (March 2-10, 2026)
Figure 5: Crypto Fear & Greed Index (March 2-10, 2026). The sentiment collapsed from 'Fear' (22) to 'Extreme Fear' (15) as prices retraced.

Typically, readings of “Extreme Fear” present a contrarian buying opportunity. As the saying goes, be greedy when others are fearful. However, given the macro headwinds, caution is warranted. The rapid shift from neutral sentiment (around 50) just weeks ago to extreme fear highlights how fragile investor confidence is currently. This fear is not just retail driven; the ETF outflows suggest institutions are equally jittery.


7. Key Events & Catalysts


Several pivotal events are shaping the market narrative for March 2026:


    • US-Iran Tensions: Geopolitical instability in the Middle East has triggered a risk off environment. Investors are fleeing speculative assets like altcoins and moving into traditional safe havens like Gold and the US Dollar, with Bitcoin caught in the middle as both a risk asset and a digital hedge.
    • 20 Millionth Bitcoin Milestone (March 11-15): The network is approaching a historic milestone, the mining of the 20 millionth Bitcoin. With a hard cap of 21 million, this event reinforces the scarcity narrative that underpins Bitcoin’s long term value proposition.
    • FOMC Meeting (March 17-18): The Federal Reserve is scheduled to meet mid month. Markets are currently pricing in a rate hold, but all eyes will be on Chair Jerome Powell’s press conference for clues about future rate cuts. Any hawkish surprise could send crypto prices lower.


8. Technical Analysis & Key Levels


From a technical perspective, Bitcoin is currently in a no man’s land between major support and resistance levels.


Bitcoin (BTC):

    • Resistance: The $72,000 – $74,000 zone is now a confirmed double top formation. Breaking this level will require significant volume and a positive macro catalyst.
    • Support: The immediate support is at $63,700, a level identified as critical by on chain analysis firms. Below that, the $60,000 psychological level stands as the last line of defense before a potential drop to $52,000.

Ethereum (ETH):

    • Resistance: The $2,150 level, previously support, has flipped into formidable resistance. ETH needs to reclaim $2,000 convincingly to neutralize the immediate bearish bias.
    • Support: $1,750 is the next major structural support level on the weekly chart.


9. Arbitrage Opportunities in Volatile Markets


While directional traders struggle with volatility, arbitrage traders thrive in it. The recent price disconnects between centralized exchanges (CEXs) and decentralized exchanges (DEXs) have created lucrative opportunities.


During the rapid sell off on March 6, price discrepancies for Bitcoin across major exchanges like Binance, Coinbase, and Kraken widened to as much as 1.5% momentarily. Similarly, the fragmentation of Ethereum liquidity across L2s like Arbitrum, Optimism, and Base meant that ETH was trading at different prices simultaneously across these networks.


Specifically, the “Kimchi Premium” (the price difference of BTC on South Korean exchanges vs. global exchanges) spiked to over 4% this week as local demand remained sticky despite the global sell off. Automated arbitrage bots, like those developed by NeuralArB, are designed to detect and exploit these inefficiencies in milliseconds, locking in risk free profits regardless of market direction.

Profitable in Any Market Condition


Join 10,000+ traders using NeuralArB’s neural network technology to profit from market inefficiencies 24/7. Whether the market goes up or down, the spread is yours.


10. What to Watch Next: March 11-20 Outlook


Looking ahead, the next 10 days will be critical. The mining of the 20 millionth Bitcoin could provide a much needed narrative boost, potentially sparking a relief rally. However, the looming FOMC meeting on March 17-18 hangs over the market like a dark cloud.


Traders should closely monitor the $63,700 support level for Bitcoin. A clean bounce here could set the stage for another attempt at $70,000. Conversely, a daily close below this level would confirm a bearish trend reversal. In the altcoin sector, keep an eye on Solana’s network performance post upgrade; stability here could attract capital back into the ecosystem.


11. Downloadable Market Data


Get the raw data used in this report for your own analysis. Includes daily price data for BTC, ETH, SOL, XRP, and ETF flow metrics.


Conclusion


The week of March 2-10, 2026, served as a stark reminder of the crypto market’s inherent volatility. From the euphoria of $72K to the fear of sub-$60K, emotions have run the gamut. While the short term outlook remains clouded by geopolitical and macroeconomic uncertainty, the underlying fundamentals of scarcity (Bitcoin) and technological progress (Solana, Ethereum) remain intact.


For passive investors, this is a time for patience. For active traders and arbitrageurs, however, this volatility is a gift. The widening spreads and price inefficiencies offer a unique chance to generate alpha without taking on directional risk.


💬 Frequently Asked Questions (FAQ)

Why did Bitcoin drop from $72K to $67K in March 2026?

The drop was primarily triggered by a risk off sentiment in global markets due to escalating US-Iran tensions, combined with $227M in net outflows from Bitcoin ETFs on March 6, indicating institutional profit taking.

The Fear and Greed Index measures market sentiment on a scale of 0-100. It is currently at 18 (Extreme Fear) because of the rapid price drop and geopolitical uncertainty. This often signals that the market is oversold.

Spot ETF flows represent direct buying (inflows) or selling (outflows) of actual Bitcoin by large institutional funds. Positive flows increase demand and price, while negative flows (like those seen on March 6) increase supply and lower price.

Between March 11-15, 2026, the Bitcoin network will mine its 20 millionth coin. Since the total supply is capped at 21 million, this milestone highlights that less than 5% of all Bitcoin remains to be mined, reinforcing its scarcity.

Traders can use arbitrage strategies to profit from price differences across exchanges, which tend to widen during volatility. Tools like NeuralArB automate this process to capture profits without betting on the market’s direction.


📱 Stay Connected:

  • Twitter/X for real-time market alerts
  • Telegram community for live trading discussions

🔗 Related Analysis:


Data Sources:

Disclaimer: This analysis is for educational purposes. Arbitrage trading involves substantial risk, including custody risk, regulatory risk, and execution risk. Past performance is not indicative of future results. Never risk capital you cannot afford to lose. Consult qualified financial and legal advisors before trading.

Max Takeda

Max Takeda is the Chief Technology Officer at NeuralArB, where he leads the company’s technology vision, overseeing the development and implementation of cutting-edge AI algorithms and blockchain solutions that power crypto arbitrage trading efficiency. With a strong background in software engineering, artificial intelligence, and distributed ledger technology, Max combines technical expertise with strategic thinking to drive NeuralArB's mission to revolutionize the cryptocurrency trading space. Connect with Max on Twitter: @MaxTakeda91

Crypto Market Update – March 2–10, 2026: BTC $72K, Extreme Fear & Arbitrage Signals

Crypto Market Update March 2-10

Executive Summary


The first week of March 2026 has been defined by extreme volatility, with Bitcoin (BTC) surging to a mid week high of $72,400 before retracing sharply to the $67,000 range. This rollercoaster price action has been driven by a complex mix of geopolitical tensions (US-Iran), fluctuating ETF flows, and the upcoming “20 Millionth Bitcoin” milestone. Ethereum (ETH) continues to struggle, breaking below the psychological $2,000 support level, while altcoins like XRP and Solana face significant headwinds. Institutional sentiment has shifted rapidly from greed to “Extreme Fear” (18/100), creating a unique environment for arbitrage strategies. This report breaks down the critical data points, technical levels, and AI-driven arbitrage opportunities that defined the market between March 2 and March 10, 2026.


1. Market Overview: The Week That Shook Crypto


The crypto market experienced one of its most volatile weeks in 2026 between March 2 and March 10. Total market capitalization dropped from a high of $2.56 trillion on March 5 to approximately $2.21 trillion by March 10, wiping out over $350 billion in value in just five days. This swift reversal underscores the fragility of the current market structure, which remains heavily dependent on macroeconomic signals and geopolitical stability.


The week began with optimism as Bitcoin reclaimed the $68,000 level on March 2, buoyed by renewed institutional interest and positive ETF inflows. By midweek, specifically March 5, the market appeared poised for a breakout. Bitcoin touched an intraday high of $72,400, and major altcoins like Ethereum, Solana, and XRP posted 8% daily gains. However, this bullish momentum was short lived.


A sudden shift in global risk sentiment, triggered by escalating tensions between the US and Iran, sent shockwaves through risk assets. By March 6, the narrative had flipped entirely. Bitcoin plunged below $71,000, and significant ETF outflows totaling $227.8 million signaled a retreat by institutional investors. The sell off intensified over the weekend, dragging the total crypto market cap down to $2.29 trillion by March 9, with Bitcoin hovering precariously around $67,300.

Total Market Cap vs. BTC Dominance (March 2-10, 2026)
Figure 1: Total Market Cap vs. BTC Dominance (March 2-10, 2026). The sharp decline in market cap coincides with rising BTC dominance, indicating a flight to safety within the crypto ecosystem.

Notably, Bitcoin Dominance has been on a steady upward trajectory, rising from 57.1% on March 2 to 58.5% by March 10. This flight to quality within the crypto ecosystem suggests that while investors are fearful, they prefer holding Bitcoin over riskier altcoins during periods of uncertainty. The divergence between Bitcoin’s relative resilience and the broader altcoin market’s weakness is a defining theme of this period, offering distinct opportunities for pairs trading and arbitrage.


2. Bitcoin Analysis: From $72K Highs to $67K Reality


Bitcoin’s price action this week serves as a masterclass in market volatility. The leading cryptocurrency started the week trading at $68,200, finding strong support above the 50 day moving average. The early part of the week was characterized by aggressive buying, driven largely by the “20 Millionth Bitcoin Mined” narrative a scarcity event expected to occur between March 11 and 15.


On March 4, buying pressure intensified, pushing BTC to an intraday high of $71,890. This momentum carried into March 5, where Bitcoin peaked at $72,400. At this level, market sentiment was overwhelmingly bullish, with many analysts predicting a swift move to new all time highs. However, the $72,000 – $74,000 zone proved to be a formidable resistance level once again.

“Bitcoin’s rejection at $72,400 wasn’t just technical; it was a liquidity event. Over $220 million in long positions were liquidated in less than 4 hours on March 6.”

The reversal began on March 6, coinciding with a broader risk off move in global markets. Bitcoin shed over $1,500 in hours, closing the day near $70,500. The selling pressure continued through the weekend, a time typically characterized by lower liquidity and higher volatility. By March 9, BTC had retraced to $67,337, effectively erasing the gains from the midweek rally.

BTC & ETH Price Action March 2–10, 2026
Figure 2: Bitcoin and Ethereum Price Action (March 2-10, 2026). Note the divergence as BTC holds relative strength while ETH makes lower lows.

As of early March 10, prediction markets on platforms like Robinhood are pricing Bitcoin in the $58,500 – $59,000 range, indicating extreme bearish sentiment has taken hold. This drastic drop represents a critical test of the $60,000 psychological support. If this level fails to hold, technical analysis suggests a potential slide toward the $52,000 region. Conversely, a bounce here could confirm a higher low on the weekly timeframe, keeping the long term bullish structure intact.

Capitalize on Volatility


Discover how NeuralArB’s AI-powered bots captured 2.4% arbitrage spreads during this week’s volatility. Don’t just watch the market move profit from it.


3. Ethereum’s Struggle: Breaking Down Below $2,000


While Bitcoin has managed to retain some of its value relative to its highs, Ethereum (ETH) has faced a much more challenging environment. The second largest cryptocurrency by market capitalization began the week trading at $2,050, struggling to gain momentum despite the broader market rally.


Ethereum’s weakness is structural. The ETH/BTC ratio has continued to bleed, hitting multi year lows. Even during the midweek rally on March 5, where ETH briefly surged to $2,260, it failed to sustain these levels. The subsequent rejection was swift and brutal. By March 8, Ethereum had broken below the critical psychological support of $2,000, trading at $1,980.


By March 10, ETH had slid further to $1,820, a level not seen since late 2024. Several factors are contributing to this underperformance:


    • Lack of Institutional Flows: Unlike Bitcoin, which has seen substantial ETF inflows, Ethereum spot ETFs have seen muted interest, with net outflows recorded on multiple days this week.
    • L2 Fragmentation: Liquidity continues to fragment across various Layer 2 solutions, diluting the value accrual to the mainnet asset.
    • Regulatory Uncertainty: Renewed scrutiny on Proof-of-Stake assets by global regulators has dampened sentiment.

The upcoming “Glamsterdam” upgrade, slated for H1 2026, promises to address some scalability issues, but the market seems unwilling to price in this future catalyst just yet. For now, ETH remains in a precarious position, with bears eyeing the $1,750 support zone as the next target.


4. Altcoin Performance: XRP, Solana, and BNB in Focus


The Altcoin Season narrative took a significant hit this week as liquidity drained from mid and low cap assets back into Bitcoin and stablecoins. However, specific assets showed idiosyncratic price action driven by ecosystem specific developments.


XRP: Volatility Amidst ETF Outflows


XRP started the week strong at $1.62 and rallied to $1.74 on March 5. However, it faced significant headwinds from ETF outflows, with over $22 million exiting XRP investment products in just two days (March 6-7). By March 10, XRP had retraced to $1.38. Despite this, the community remains optimistic about a $1.50 target, contingent on a broader market recovery.


Solana (SOL): Upgrade Success vs. Price Decline


Solana’s fundamental narrative remains strong. This week saw the successful approval of the Alpenglow upgrade, with 98.27% of stakers voting in favor. This upgrade is set to reduce finality times to 100-150ms, a massive technical achievement. Price wise, however, SOL was not immune to the market downturn. From a high of $90.10 on March 5, it dropped to $80.20 by March 10. The $80 level is a critical support zone for bulls to defend.


BNB: Relative Stability


Binance Coin (BNB) exhibited its trademark resilience, trading in a relatively tight range between $620 and $651. Closing the week at roughly $634, BNB continues to act as a defensive asset within the altcoin sector, outperforming both ETH and SOL on a relative basis.

Altcoin Performance (XRP, SOL, BNB) March 2026
Figure 3: Relative Performance of XRP, Solana, and BNB (Rebased to 100). Solana showed the highest volatility, while BNB remained the most stable.


5. ETF Flows: The Institutional Money Story


Institutional flows through US Spot ETFs continue to be a primary driver of Bitcoin’s short term price action. The week began with a massive vote of confidence; on March 2, Bitcoin ETFs recorded $521 million in net inflows, led predominantly by BlackRock‘s IBIT fund.


This buying spree continued through March 4, culminating in a 5-day cumulative inflow of over $1.4 billion. This capital injection was the fuel behind Bitcoin’s run to $72,400. However, the sentiment flipped as quickly as it had arrived. On March 6, the market saw net outflows of $227.83 million, with BlackRock’s IBIT alone seeing nearly $89 million in redemptions.

Bitcoin Spot ETF
Figure 4: Daily Net Flows for US Spot Bitcoin ETFs (USD Millions). The sharp reversal from inflows to outflows on March 6 marks the local top for BTC price.

This “hot and cold” behavior from institutional investors suggests a tactical approach to the current market environment. Institutions are happy to ride momentum but are quick to de risk at the first sign of geopolitical trouble or technical weakness. Monitoring daily ETF flow data has become essential for short term trading strategies.


6. Market Sentiment: Extreme Fear Grips Traders


Market sentiment is perhaps the most telling indicator of the current environment. The Crypto Fear & Greed Index, a popular metric for gauging market emotion, plummeted to 18/100 (Extreme Fear) by March 9. This is the lowest sustained reading since the bottom of the 2022 bear market.

Crypto Fear & Greed Index (March 2-10, 2026)
Figure 5: Crypto Fear & Greed Index (March 2-10, 2026). The sentiment collapsed from 'Fear' (22) to 'Extreme Fear' (15) as prices retraced.

Typically, readings of “Extreme Fear” present a contrarian buying opportunity. As the saying goes, be greedy when others are fearful. However, given the macro headwinds, caution is warranted. The rapid shift from neutral sentiment (around 50) just weeks ago to extreme fear highlights how fragile investor confidence is currently. This fear is not just retail driven; the ETF outflows suggest institutions are equally jittery.


7. Key Events & Catalysts


Several pivotal events are shaping the market narrative for March 2026:


    • US-Iran Tensions: Geopolitical instability in the Middle East has triggered a risk off environment. Investors are fleeing speculative assets like altcoins and moving into traditional safe havens like Gold and the US Dollar, with Bitcoin caught in the middle as both a risk asset and a digital hedge.
    • 20 Millionth Bitcoin Milestone (March 11-15): The network is approaching a historic milestone, the mining of the 20 millionth Bitcoin. With a hard cap of 21 million, this event reinforces the scarcity narrative that underpins Bitcoin’s long term value proposition.
    • FOMC Meeting (March 17-18): The Federal Reserve is scheduled to meet mid month. Markets are currently pricing in a rate hold, but all eyes will be on Chair Jerome Powell’s press conference for clues about future rate cuts. Any hawkish surprise could send crypto prices lower.


8. Technical Analysis & Key Levels


From a technical perspective, Bitcoin is currently in a no man’s land between major support and resistance levels.


Bitcoin (BTC):

    • Resistance: The $72,000 – $74,000 zone is now a confirmed double top formation. Breaking this level will require significant volume and a positive macro catalyst.
    • Support: The immediate support is at $63,700, a level identified as critical by on chain analysis firms. Below that, the $60,000 psychological level stands as the last line of defense before a potential drop to $52,000.

Ethereum (ETH):

    • Resistance: The $2,150 level, previously support, has flipped into formidable resistance. ETH needs to reclaim $2,000 convincingly to neutralize the immediate bearish bias.
    • Support: $1,750 is the next major structural support level on the weekly chart.


9. Arbitrage Opportunities in Volatile Markets


While directional traders struggle with volatility, arbitrage traders thrive in it. The recent price disconnects between centralized exchanges (CEXs) and decentralized exchanges (DEXs) have created lucrative opportunities.


During the rapid sell off on March 6, price discrepancies for Bitcoin across major exchanges like Binance, Coinbase, and Kraken widened to as much as 1.5% momentarily. Similarly, the fragmentation of Ethereum liquidity across L2s like Arbitrum, Optimism, and Base meant that ETH was trading at different prices simultaneously across these networks.


Specifically, the “Kimchi Premium” (the price difference of BTC on South Korean exchanges vs. global exchanges) spiked to over 4% this week as local demand remained sticky despite the global sell off. Automated arbitrage bots, like those developed by NeuralArB, are designed to detect and exploit these inefficiencies in milliseconds, locking in risk free profits regardless of market direction.

Profitable in Any Market Condition


Join 10,000+ traders using NeuralArB’s neural network technology to profit from market inefficiencies 24/7. Whether the market goes up or down, the spread is yours.


10. What to Watch Next: March 11-20 Outlook


Looking ahead, the next 10 days will be critical. The mining of the 20 millionth Bitcoin could provide a much needed narrative boost, potentially sparking a relief rally. However, the looming FOMC meeting on March 17-18 hangs over the market like a dark cloud.


Traders should closely monitor the $63,700 support level for Bitcoin. A clean bounce here could set the stage for another attempt at $70,000. Conversely, a daily close below this level would confirm a bearish trend reversal. In the altcoin sector, keep an eye on Solana’s network performance post upgrade; stability here could attract capital back into the ecosystem.


11. Downloadable Market Data


Get the raw data used in this report for your own analysis. Includes daily price data for BTC, ETH, SOL, XRP, and ETF flow metrics.


Conclusion


The week of March 2-10, 2026, served as a stark reminder of the crypto market’s inherent volatility. From the euphoria of $72K to the fear of sub-$60K, emotions have run the gamut. While the short term outlook remains clouded by geopolitical and macroeconomic uncertainty, the underlying fundamentals of scarcity (Bitcoin) and technological progress (Solana, Ethereum) remain intact.


For passive investors, this is a time for patience. For active traders and arbitrageurs, however, this volatility is a gift. The widening spreads and price inefficiencies offer a unique chance to generate alpha without taking on directional risk.


💬 Frequently Asked Questions (FAQ)

Why did Bitcoin drop from $72K to $67K in March 2026?

The drop was primarily triggered by a risk off sentiment in global markets due to escalating US-Iran tensions, combined with $227M in net outflows from Bitcoin ETFs on March 6, indicating institutional profit taking.

The Fear and Greed Index measures market sentiment on a scale of 0-100. It is currently at 18 (Extreme Fear) because of the rapid price drop and geopolitical uncertainty. This often signals that the market is oversold.

Spot ETF flows represent direct buying (inflows) or selling (outflows) of actual Bitcoin by large institutional funds. Positive flows increase demand and price, while negative flows (like those seen on March 6) increase supply and lower price.

Between March 11-15, 2026, the Bitcoin network will mine its 20 millionth coin. Since the total supply is capped at 21 million, this milestone highlights that less than 5% of all Bitcoin remains to be mined, reinforcing its scarcity.

Traders can use arbitrage strategies to profit from price differences across exchanges, which tend to widen during volatility. Tools like NeuralArB automate this process to capture profits without betting on the market’s direction.


📱 Stay Connected:

  • Twitter/X for real-time market alerts
  • Telegram community for live trading discussions

🔗 Related Analysis:


Data Sources:

Disclaimer: This analysis is for educational purposes. Arbitrage trading involves substantial risk, including custody risk, regulatory risk, and execution risk. Past performance is not indicative of future results. Never risk capital you cannot afford to lose. Consult qualified financial and legal advisors before trading.

Max Takeda

Max Takeda is the Chief Technology Officer at NeuralArB, where he leads the company’s technology vision, overseeing the development and implementation of cutting-edge AI algorithms and blockchain solutions that power crypto arbitrage trading efficiency. With a strong background in software engineering, artificial intelligence, and distributed ledger technology, Max combines technical expertise with strategic thinking to drive NeuralArB's mission to revolutionize the cryptocurrency trading space. Connect with Max on Twitter: @MaxTakeda91

Crypto Market Update – March 2–10, 2026: BTC $72K, Extreme Fear & Arbitrage Signals

Crypto Market Update March 2-10

Executive Summary


The first week of March 2026 has been defined by extreme volatility, with Bitcoin (BTC) surging to a mid week high of $72,400 before retracing sharply to the $67,000 range. This rollercoaster price action has been driven by a complex mix of geopolitical tensions (US-Iran), fluctuating ETF flows, and the upcoming “20 Millionth Bitcoin” milestone. Ethereum (ETH) continues to struggle, breaking below the psychological $2,000 support level, while altcoins like XRP and Solana face significant headwinds. Institutional sentiment has shifted rapidly from greed to “Extreme Fear” (18/100), creating a unique environment for arbitrage strategies. This report breaks down the critical data points, technical levels, and AI-driven arbitrage opportunities that defined the market between March 2 and March 10, 2026.


1. Market Overview: The Week That Shook Crypto


The crypto market experienced one of its most volatile weeks in 2026 between March 2 and March 10. Total market capitalization dropped from a high of $2.56 trillion on March 5 to approximately $2.21 trillion by March 10, wiping out over $350 billion in value in just five days. This swift reversal underscores the fragility of the current market structure, which remains heavily dependent on macroeconomic signals and geopolitical stability.


The week began with optimism as Bitcoin reclaimed the $68,000 level on March 2, buoyed by renewed institutional interest and positive ETF inflows. By midweek, specifically March 5, the market appeared poised for a breakout. Bitcoin touched an intraday high of $72,400, and major altcoins like Ethereum, Solana, and XRP posted 8% daily gains. However, this bullish momentum was short lived.


A sudden shift in global risk sentiment, triggered by escalating tensions between the US and Iran, sent shockwaves through risk assets. By March 6, the narrative had flipped entirely. Bitcoin plunged below $71,000, and significant ETF outflows totaling $227.8 million signaled a retreat by institutional investors. The sell off intensified over the weekend, dragging the total crypto market cap down to $2.29 trillion by March 9, with Bitcoin hovering precariously around $67,300.

Total Market Cap vs. BTC Dominance (March 2-10, 2026)
Figure 1: Total Market Cap vs. BTC Dominance (March 2-10, 2026). The sharp decline in market cap coincides with rising BTC dominance, indicating a flight to safety within the crypto ecosystem.

Notably, Bitcoin Dominance has been on a steady upward trajectory, rising from 57.1% on March 2 to 58.5% by March 10. This flight to quality within the crypto ecosystem suggests that while investors are fearful, they prefer holding Bitcoin over riskier altcoins during periods of uncertainty. The divergence between Bitcoin’s relative resilience and the broader altcoin market’s weakness is a defining theme of this period, offering distinct opportunities for pairs trading and arbitrage.


2. Bitcoin Analysis: From $72K Highs to $67K Reality


Bitcoin’s price action this week serves as a masterclass in market volatility. The leading cryptocurrency started the week trading at $68,200, finding strong support above the 50 day moving average. The early part of the week was characterized by aggressive buying, driven largely by the “20 Millionth Bitcoin Mined” narrative a scarcity event expected to occur between March 11 and 15.


On March 4, buying pressure intensified, pushing BTC to an intraday high of $71,890. This momentum carried into March 5, where Bitcoin peaked at $72,400. At this level, market sentiment was overwhelmingly bullish, with many analysts predicting a swift move to new all time highs. However, the $72,000 – $74,000 zone proved to be a formidable resistance level once again.

“Bitcoin’s rejection at $72,400 wasn’t just technical; it was a liquidity event. Over $220 million in long positions were liquidated in less than 4 hours on March 6.”

The reversal began on March 6, coinciding with a broader risk off move in global markets. Bitcoin shed over $1,500 in hours, closing the day near $70,500. The selling pressure continued through the weekend, a time typically characterized by lower liquidity and higher volatility. By March 9, BTC had retraced to $67,337, effectively erasing the gains from the midweek rally.

BTC & ETH Price Action March 2–10, 2026
Figure 2: Bitcoin and Ethereum Price Action (March 2-10, 2026). Note the divergence as BTC holds relative strength while ETH makes lower lows.

As of early March 10, prediction markets on platforms like Robinhood are pricing Bitcoin in the $58,500 – $59,000 range, indicating extreme bearish sentiment has taken hold. This drastic drop represents a critical test of the $60,000 psychological support. If this level fails to hold, technical analysis suggests a potential slide toward the $52,000 region. Conversely, a bounce here could confirm a higher low on the weekly timeframe, keeping the long term bullish structure intact.

Capitalize on Volatility


Discover how NeuralArB’s AI-powered bots captured 2.4% arbitrage spreads during this week’s volatility. Don’t just watch the market move profit from it.


3. Ethereum’s Struggle: Breaking Down Below $2,000


While Bitcoin has managed to retain some of its value relative to its highs, Ethereum (ETH) has faced a much more challenging environment. The second largest cryptocurrency by market capitalization began the week trading at $2,050, struggling to gain momentum despite the broader market rally.


Ethereum’s weakness is structural. The ETH/BTC ratio has continued to bleed, hitting multi year lows. Even during the midweek rally on March 5, where ETH briefly surged to $2,260, it failed to sustain these levels. The subsequent rejection was swift and brutal. By March 8, Ethereum had broken below the critical psychological support of $2,000, trading at $1,980.


By March 10, ETH had slid further to $1,820, a level not seen since late 2024. Several factors are contributing to this underperformance:


    • Lack of Institutional Flows: Unlike Bitcoin, which has seen substantial ETF inflows, Ethereum spot ETFs have seen muted interest, with net outflows recorded on multiple days this week.
    • L2 Fragmentation: Liquidity continues to fragment across various Layer 2 solutions, diluting the value accrual to the mainnet asset.
    • Regulatory Uncertainty: Renewed scrutiny on Proof-of-Stake assets by global regulators has dampened sentiment.

The upcoming “Glamsterdam” upgrade, slated for H1 2026, promises to address some scalability issues, but the market seems unwilling to price in this future catalyst just yet. For now, ETH remains in a precarious position, with bears eyeing the $1,750 support zone as the next target.


4. Altcoin Performance: XRP, Solana, and BNB in Focus


The Altcoin Season narrative took a significant hit this week as liquidity drained from mid and low cap assets back into Bitcoin and stablecoins. However, specific assets showed idiosyncratic price action driven by ecosystem specific developments.


XRP: Volatility Amidst ETF Outflows


XRP started the week strong at $1.62 and rallied to $1.74 on March 5. However, it faced significant headwinds from ETF outflows, with over $22 million exiting XRP investment products in just two days (March 6-7). By March 10, XRP had retraced to $1.38. Despite this, the community remains optimistic about a $1.50 target, contingent on a broader market recovery.


Solana (SOL): Upgrade Success vs. Price Decline


Solana’s fundamental narrative remains strong. This week saw the successful approval of the Alpenglow upgrade, with 98.27% of stakers voting in favor. This upgrade is set to reduce finality times to 100-150ms, a massive technical achievement. Price wise, however, SOL was not immune to the market downturn. From a high of $90.10 on March 5, it dropped to $80.20 by March 10. The $80 level is a critical support zone for bulls to defend.


BNB: Relative Stability


Binance Coin (BNB) exhibited its trademark resilience, trading in a relatively tight range between $620 and $651. Closing the week at roughly $634, BNB continues to act as a defensive asset within the altcoin sector, outperforming both ETH and SOL on a relative basis.

Altcoin Performance (XRP, SOL, BNB) March 2026
Figure 3: Relative Performance of XRP, Solana, and BNB (Rebased to 100). Solana showed the highest volatility, while BNB remained the most stable.


5. ETF Flows: The Institutional Money Story


Institutional flows through US Spot ETFs continue to be a primary driver of Bitcoin’s short term price action. The week began with a massive vote of confidence; on March 2, Bitcoin ETFs recorded $521 million in net inflows, led predominantly by BlackRock‘s IBIT fund.


This buying spree continued through March 4, culminating in a 5-day cumulative inflow of over $1.4 billion. This capital injection was the fuel behind Bitcoin’s run to $72,400. However, the sentiment flipped as quickly as it had arrived. On March 6, the market saw net outflows of $227.83 million, with BlackRock’s IBIT alone seeing nearly $89 million in redemptions.

Bitcoin Spot ETF
Figure 4: Daily Net Flows for US Spot Bitcoin ETFs (USD Millions). The sharp reversal from inflows to outflows on March 6 marks the local top for BTC price.

This “hot and cold” behavior from institutional investors suggests a tactical approach to the current market environment. Institutions are happy to ride momentum but are quick to de risk at the first sign of geopolitical trouble or technical weakness. Monitoring daily ETF flow data has become essential for short term trading strategies.


6. Market Sentiment: Extreme Fear Grips Traders


Market sentiment is perhaps the most telling indicator of the current environment. The Crypto Fear & Greed Index, a popular metric for gauging market emotion, plummeted to 18/100 (Extreme Fear) by March 9. This is the lowest sustained reading since the bottom of the 2022 bear market.

Crypto Fear & Greed Index (March 2-10, 2026)
Figure 5: Crypto Fear & Greed Index (March 2-10, 2026). The sentiment collapsed from 'Fear' (22) to 'Extreme Fear' (15) as prices retraced.

Typically, readings of “Extreme Fear” present a contrarian buying opportunity. As the saying goes, be greedy when others are fearful. However, given the macro headwinds, caution is warranted. The rapid shift from neutral sentiment (around 50) just weeks ago to extreme fear highlights how fragile investor confidence is currently. This fear is not just retail driven; the ETF outflows suggest institutions are equally jittery.


7. Key Events & Catalysts


Several pivotal events are shaping the market narrative for March 2026:


    • US-Iran Tensions: Geopolitical instability in the Middle East has triggered a risk off environment. Investors are fleeing speculative assets like altcoins and moving into traditional safe havens like Gold and the US Dollar, with Bitcoin caught in the middle as both a risk asset and a digital hedge.
    • 20 Millionth Bitcoin Milestone (March 11-15): The network is approaching a historic milestone, the mining of the 20 millionth Bitcoin. With a hard cap of 21 million, this event reinforces the scarcity narrative that underpins Bitcoin’s long term value proposition.
    • FOMC Meeting (March 17-18): The Federal Reserve is scheduled to meet mid month. Markets are currently pricing in a rate hold, but all eyes will be on Chair Jerome Powell’s press conference for clues about future rate cuts. Any hawkish surprise could send crypto prices lower.


8. Technical Analysis & Key Levels


From a technical perspective, Bitcoin is currently in a no man’s land between major support and resistance levels.


Bitcoin (BTC):

    • Resistance: The $72,000 – $74,000 zone is now a confirmed double top formation. Breaking this level will require significant volume and a positive macro catalyst.
    • Support: The immediate support is at $63,700, a level identified as critical by on chain analysis firms. Below that, the $60,000 psychological level stands as the last line of defense before a potential drop to $52,000.

Ethereum (ETH):

    • Resistance: The $2,150 level, previously support, has flipped into formidable resistance. ETH needs to reclaim $2,000 convincingly to neutralize the immediate bearish bias.
    • Support: $1,750 is the next major structural support level on the weekly chart.


9. Arbitrage Opportunities in Volatile Markets


While directional traders struggle with volatility, arbitrage traders thrive in it. The recent price disconnects between centralized exchanges (CEXs) and decentralized exchanges (DEXs) have created lucrative opportunities.


During the rapid sell off on March 6, price discrepancies for Bitcoin across major exchanges like Binance, Coinbase, and Kraken widened to as much as 1.5% momentarily. Similarly, the fragmentation of Ethereum liquidity across L2s like Arbitrum, Optimism, and Base meant that ETH was trading at different prices simultaneously across these networks.


Specifically, the “Kimchi Premium” (the price difference of BTC on South Korean exchanges vs. global exchanges) spiked to over 4% this week as local demand remained sticky despite the global sell off. Automated arbitrage bots, like those developed by NeuralArB, are designed to detect and exploit these inefficiencies in milliseconds, locking in risk free profits regardless of market direction.

Profitable in Any Market Condition


Join 10,000+ traders using NeuralArB’s neural network technology to profit from market inefficiencies 24/7. Whether the market goes up or down, the spread is yours.


10. What to Watch Next: March 11-20 Outlook


Looking ahead, the next 10 days will be critical. The mining of the 20 millionth Bitcoin could provide a much needed narrative boost, potentially sparking a relief rally. However, the looming FOMC meeting on March 17-18 hangs over the market like a dark cloud.


Traders should closely monitor the $63,700 support level for Bitcoin. A clean bounce here could set the stage for another attempt at $70,000. Conversely, a daily close below this level would confirm a bearish trend reversal. In the altcoin sector, keep an eye on Solana’s network performance post upgrade; stability here could attract capital back into the ecosystem.


11. Downloadable Market Data


Get the raw data used in this report for your own analysis. Includes daily price data for BTC, ETH, SOL, XRP, and ETF flow metrics.


Conclusion


The week of March 2-10, 2026, served as a stark reminder of the crypto market’s inherent volatility. From the euphoria of $72K to the fear of sub-$60K, emotions have run the gamut. While the short term outlook remains clouded by geopolitical and macroeconomic uncertainty, the underlying fundamentals of scarcity (Bitcoin) and technological progress (Solana, Ethereum) remain intact.


For passive investors, this is a time for patience. For active traders and arbitrageurs, however, this volatility is a gift. The widening spreads and price inefficiencies offer a unique chance to generate alpha without taking on directional risk.


💬 Frequently Asked Questions (FAQ)

Why did Bitcoin drop from $72K to $67K in March 2026?

The drop was primarily triggered by a risk off sentiment in global markets due to escalating US-Iran tensions, combined with $227M in net outflows from Bitcoin ETFs on March 6, indicating institutional profit taking.

The Fear and Greed Index measures market sentiment on a scale of 0-100. It is currently at 18 (Extreme Fear) because of the rapid price drop and geopolitical uncertainty. This often signals that the market is oversold.

Spot ETF flows represent direct buying (inflows) or selling (outflows) of actual Bitcoin by large institutional funds. Positive flows increase demand and price, while negative flows (like those seen on March 6) increase supply and lower price.

Between March 11-15, 2026, the Bitcoin network will mine its 20 millionth coin. Since the total supply is capped at 21 million, this milestone highlights that less than 5% of all Bitcoin remains to be mined, reinforcing its scarcity.

Traders can use arbitrage strategies to profit from price differences across exchanges, which tend to widen during volatility. Tools like NeuralArB automate this process to capture profits without betting on the market’s direction.


📱 Stay Connected:

  • Twitter/X for real-time market alerts
  • Telegram community for live trading discussions

🔗 Related Analysis:


Data Sources:

Disclaimer: This analysis is for educational purposes. Arbitrage trading involves substantial risk, including custody risk, regulatory risk, and execution risk. Past performance is not indicative of future results. Never risk capital you cannot afford to lose. Consult qualified financial and legal advisors before trading.

Max Takeda

Max Takeda is the Chief Technology Officer at NeuralArB, where he leads the company’s technology vision, overseeing the development and implementation of cutting-edge AI algorithms and blockchain solutions that power crypto arbitrage trading efficiency. With a strong background in software engineering, artificial intelligence, and distributed ledger technology, Max combines technical expertise with strategic thinking to drive NeuralArB's mission to revolutionize the cryptocurrency trading space. Connect with Max on Twitter: @MaxTakeda91

Still have questions, contact us:

© 2026 NAB CONSULTANCY LTD. All right reserved.

These materials are for general information purposes only and are not investment advice or a recommendation or solicitation to buy, sell or hold any cryptoasset or to engage in any specific trading strategy. Some crypto products and markets are unregulated, and you may not be protected by government compensation and/or regulatory protection schemes. The unpredictable nature of the cryptoasset markets can lead to loss of funds. Tax may be payable on any return and/or on any increase in the value of your cryptoassets and you should seek independent advice on your taxation position.

All trademarks, logos, and brand names are the property of their respective owners. All company, product, and service names used in this website are for identification purposes only. Use of these names, trademarks, and brands does not imply endorsement.

NAB does not provide investment or brokerage services. All cryptocurrency spot, margin, and futures products are offered by third-party platforms. Products and services availability varies by country.

Past performance, whether actual or indicated by historical or simulated tests of strategies, is no guarantee of future performance or success. There is a possibility that you may sustain a loss equal to or greater than your entire investment regardless of which asset class you trade (i.e. cryptocurrency); therefore, you should not invest or risk money that you cannot afford to lose. Online trading is not suitable for all investors. Before trading any asset class, customers should review NFA and CFTC advisories, and other relevant disclosures. System access, trade placement, and execution may be delayed or fail due to market volatility and volume, quote delays, system and software errors, Internet traffic, outages and other unforeseen factors.

Still have questions, contact us:

© 2026 NAB CONSULTANCY LTD. All right reserved.

These materials are for general information purposes only and are not investment advice or a recommendation or solicitation to buy, sell or hold any cryptoasset or to engage in any specific trading strategy. Some crypto products and markets are unregulated, and you may not be protected by government compensation and/or regulatory protection schemes. The unpredictable nature of the cryptoasset markets can lead to loss of funds. Tax may be payable on any return and/or on any increase in the value of your cryptoassets and you should seek independent advice on your taxation position.

All trademarks, logos, and brand names are the property of their respective owners. All company, product, and service names used in this website are for identification purposes only. Use of these names, trademarks, and brands does not imply endorsement.

NAB does not provide investment or brokerage services. All cryptocurrency spot, margin, and futures products are offered by third-party platforms. Products and services availability varies by country.

Past performance, whether actual or indicated by historical or simulated tests of strategies, is no guarantee of future performance or success. There is a possibility that you may sustain a loss equal to or greater than your entire investment regardless of which asset class you trade (i.e. cryptocurrency); therefore, you should not invest or risk money that you cannot afford to lose. Online trading is not suitable for all investors. Before trading any asset class, customers should review NFA and CFTC advisories, and other relevant disclosures. System access, trade placement, and execution may be delayed or fail due to market volatility and volume, quote delays, system and software errors, Internet traffic, outages and other unforeseen factors.

Still have questions, contact us:

© 2026 NAB CONSULTANCY LTD. All right reserved.

These materials are for general information purposes only and are not investment advice or a recommendation or solicitation to buy, sell or hold any cryptoasset or to engage in any specific trading strategy. Some crypto products and markets are unregulated, and you may not be protected by government compensation and/or regulatory protection schemes. The unpredictable nature of the cryptoasset markets can lead to loss of funds. Tax may be payable on any return and/or on any increase in the value of your cryptoassets and you should seek independent advice on your taxation position.

All trademarks, logos, and brand names are the property of their respective owners. All company, product, and service names used in this website are for identification purposes only. Use of these names, trademarks, and brands does not imply endorsement.

NAB does not provide investment or brokerage services. All cryptocurrency spot, margin, and futures products are offered by third-party platforms. Products and services availability varies by country.

Past performance, whether actual or indicated by historical or simulated tests of strategies, is no guarantee of future performance or success. There is a possibility that you may sustain a loss equal to or greater than your entire investment regardless of which asset class you trade (i.e. cryptocurrency); therefore, you should not invest or risk money that you cannot afford to lose. Online trading is not suitable for all investors. Before trading any asset class, customers should review NFA and CFTC advisories, and other relevant disclosures. System access, trade placement, and execution may be delayed or fail due to market volatility and volume, quote delays, system and software errors, Internet traffic, outages and other unforeseen factors.

btc address
bc1ql27m5pygdxpmnvjzkamaj88mwphwl8q6n9n06l

Only use this insured address for BTC on the Bitcoin network. Do not send Ordinals. Lost funds cannot be recovered.