

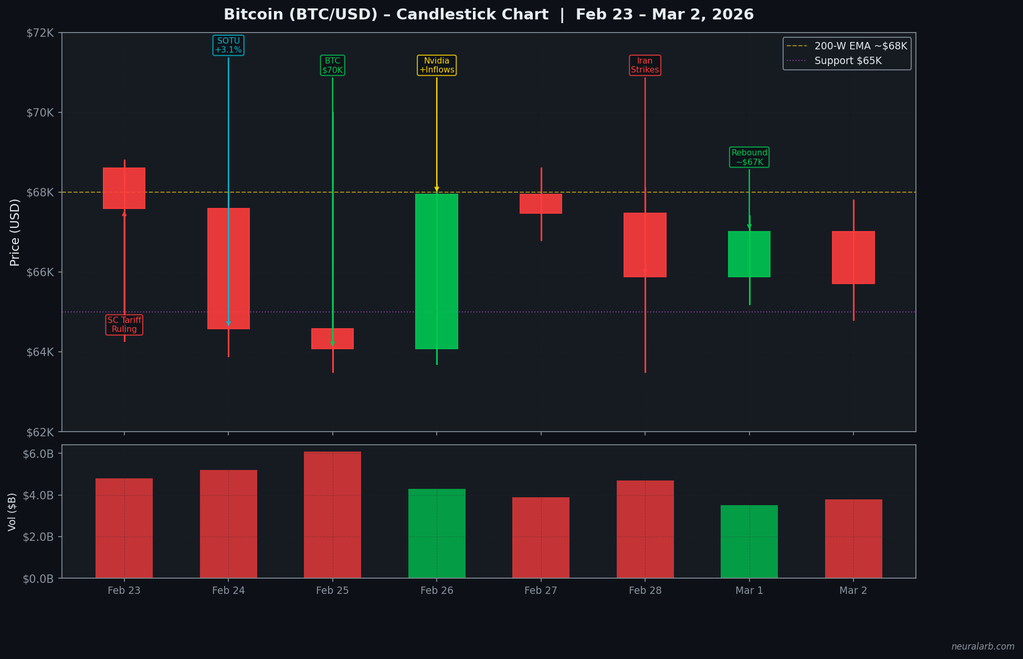
The cryptocurrency market experienced a week of intense volatility and deceptive signals from February 23 to March 2, 2026. After opening the week with a flash crash to $63,924, Bitcoin staged a powerful 9% reversal, briefly testing the psychological $70,000 resistance level on February 26 before succumbing to geopolitical headwinds and a “sell the news” reaction to President Trump’s State of the Union address.
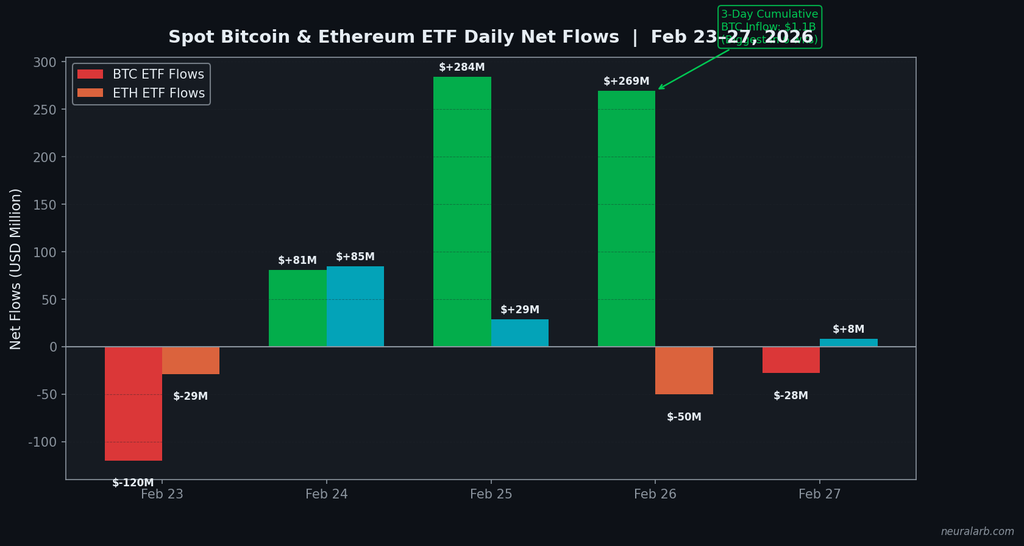
While price action remained choppy, the underlying institutional currents shifted significantly. For the first time in six weeks, U.S. spot Bitcoin ETFs recorded a net positive weekly inflow of approximately $834 million, signaling that institutional accumulation may be resuming despite retail capitulation. Meanwhile, in the altcoin sector, Polkadot (DOT) decoupled from the broader market with a massive 28.6% surge driven by protocol halving news.
This comprehensive report analyzes the technical, fundamental, and on chain drivers shaping the crypto landscape as we enter March 2026.
Executive Summary: Market Snapshot (Feb 23 – Mar 2)
| Date | BTC Price (Close) | % Change (24h) | Total Market Cap | Fear & Greed | ETF Net Flow | Key Event |
|---|---|---|---|---|---|---|
| Feb 23 | $64,510 | -3.2% | $2.29T | 5 (Extreme Fear) | -$119.7M | Flash crash to $63.9K |
| Feb 24 | $65,900 | +2.1% | $2.32T | 7 (Extreme Fear) | +$80.8M | Trump SOTU Address |
| Feb 25 | $67,100 | +1.8% | $2.38T | 9 (Extreme Fear) | +$506.5M | BlackRock IBIT $297M Inflow |
| Feb 26 | $68,434 | +2.0% | $2.44T | 11 (Extreme Fear) | +$269.4M | $70K Resistance Test |
| Feb 27 | $65,900 | -3.7% | $2.40T | 11 (Extreme Fear) | -$27.8M | US-Israel Iran Strikes |
| Feb 28 | $66,300 | +0.6% | $2.38T | 11 (Extreme Fear) | +$45.0M | 115K BTC Options Expiry |
| Mar 1 | $66,195 | -0.2% | $2.36T | 11 (Extreme Fear) | +$60.0M | Consolidation |
| Mar 2 | $65,500 | -1.1% | $2.35T | 10 (Extreme Fear) | +$20.0M | Weekly Close |
🤖 AI Quick Summary (TL;DR)
Bitcoin rallied 9% from a low of $63,924 to test $70,000 on Feb 26 before pulling back to $65,500 by week’s end. ETF flows dramatically reversed 6 weeks of bleeding with $834M in total weekly inflows, led by a massive $506.5M day on Feb 25. The Fear & Greed Index paradoxically remained in Extreme Fear (5-11) throughout the rally. Polkadot (DOT) was the standout performer, surging 28.6% following the announcement of its halving event scheduled for March 14.
1. The Week in Review: Technical Rally Meets Reality Check
The week began with palpable panic as Bitcoin plummeted to $63,924 on February 23, driven by lingering concerns over global liquidity and regulatory uncertainty. However, market dynamics shifted rapidly on Tuesday, February 24. Anticipation of pro crypto rhetoric in President Trump’s State of the Union address fueled a speculative bid, pushing BTC back above $65,000.
The real fireworks began mid week. On Wednesday and Thursday, a confluence of massive ETF inflows and a short squeeze propelled Bitcoin to an intra week high of $70,000. This 9% rally from the lows caught many bears offside, liquidating over $250 million in short positions within 24 hours. Yet, the $70,000 level proved to be a formidable resistance. As geopolitical tensions escalated in the Middle East on Friday, risk assets sold off, dragging Bitcoin back down to the $65,000–$66,000 range where it spent the weekend consolidating.
2. Bitcoin ETF Flows: The $834 Million Reversal
Perhaps the most significant development of the week was the dramatic turnaround in U.S. spot Bitcoin ETF flows. After six consecutive weeks of net outflows totaling nearly $4 billion, institutional demand roared back to life.
The pivot point occurred on February 25, when the ETFs collectively absorbed $506.5 million in a single day, the largest daily inflow in three weeks. BlackRock’s iShares Bitcoin Trust (IBIT) led the charge with $297.4 million, signaling renewed confidence from traditional finance allocators. This was followed by another robust day on February 26 ($269.4M), contributing to a 3-day inflow streak totaling $1.1 billion.
This resurgence suggests that institutional investors viewed the dip below $64,000 as a value buying opportunity, diverging sharply from retail sentiment which remained deeply fearful.
3. Trump’s State of the Union: The Non-Event That Moved Markets
President Donald Trump’s State of the Union address on February 24 was widely anticipated to be a catalyst for crypto markets. Speculators bid up prices in the hours leading up to the speech, hoping for a mention of the “Strategic Bitcoin Reserve” or digital asset innovation.
However, the longest State of the Union in history concluded without a single mention of cryptocurrency, blockchain, or digital assets. The omission triggered a classic “sell-the-news” event, although the pullback was relatively shallow. Analysts interpret this silence not as hostility, but as a sign that the administration is prioritizing executive orders and regulatory appointments (such as pro-crypto SEC commissioners) over legislative rhetoric to advance its digital asset agenda.
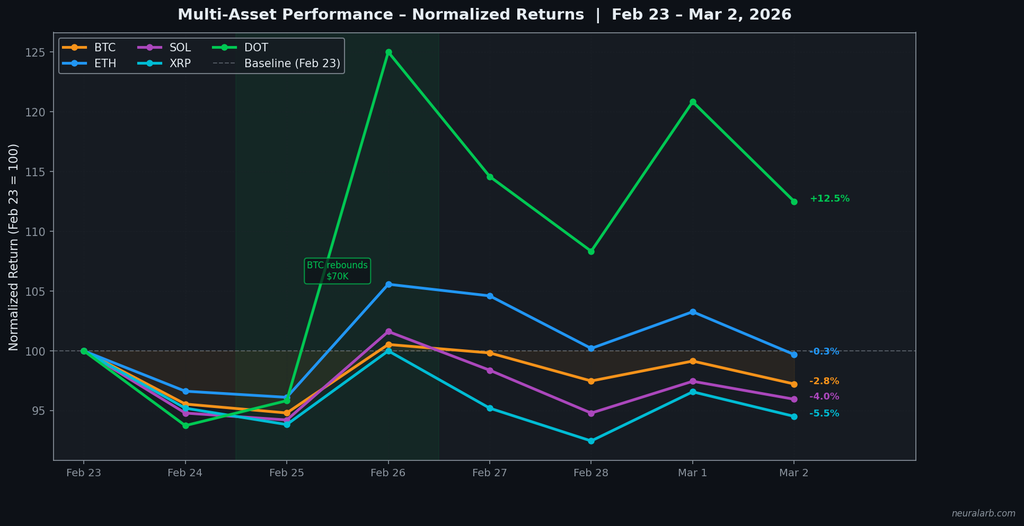
4. Ethereum & Altcoins: Mixed Signals in a Risk-On Window
While Bitcoin grabbed headlines, the altcoin market displayed significant divergence. Ethereum (ETH) struggled to maintain momentum, failing to breach resistance at $2,100 despite FalconX reporting heavy institutional demand for call options in the $2,000–$2,200 range.
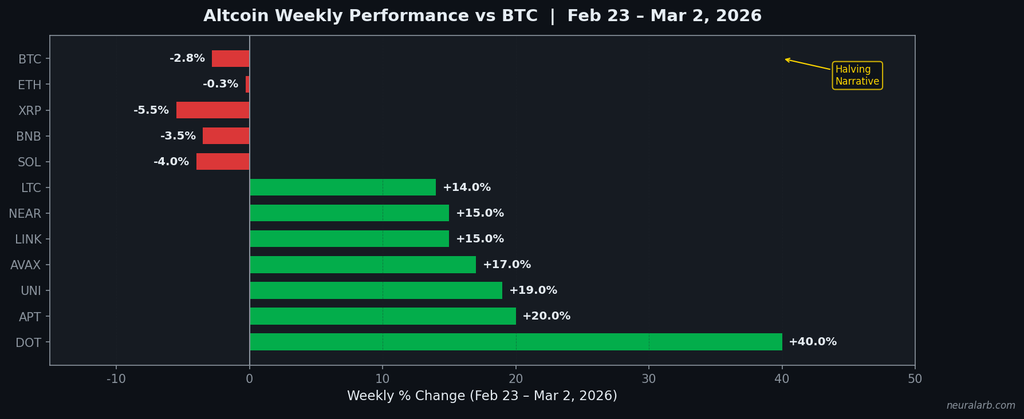
The standout performer of the week was Polkadot (DOT). The interoperability protocol surged 28.6%, decoupling from the broader market following the announcement of a halving event scheduled for March 14. This supply shock narrative drove DOT from $5.20 to over $6.69, while other major altcoins like Solana (SOL) and XRP ended the week in the red.
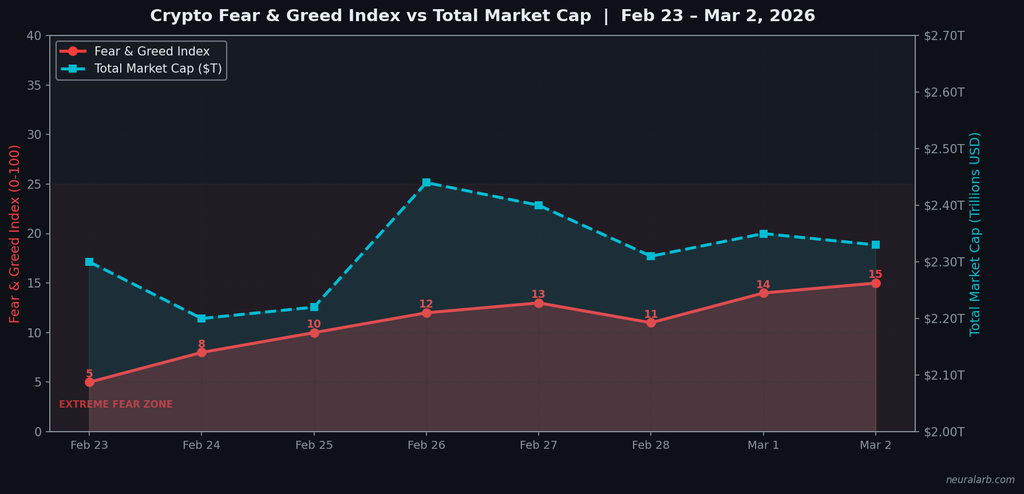
5. Market Sentiment: The Extreme Fear Paradox
A striking anomaly defined this week’s market dynamics: price rallied while sentiment remained frozen in terror. The Crypto Fear & Greed Index hovered between 5 and 11 (Extreme Fear) throughout the entire week, even as total crypto market capitalization added over $150 billion.
This divergence—rising prices amidst peak pessimism—is often a hallmark of a bottoming process. It indicates that the rally was driven primarily by short covering (technical buying) rather than renewed organic optimism. Historically, sustainable bull runs require sentiment to shift from Fear to Neutral as participation broadens.
6. CLARITY Act Update: JPMorgan’s Mid-2026 Prediction
On the regulatory front, clarity remains elusive but hopeful. JPMorgan released a report on February 28 predicting that the Digital Asset Market CLARITY Act could pass by mid-year 2026. This legislation, which aims to clearly delineate jurisdiction between the SEC and CFTC, is seen as a critical catalyst for the next phase of institutional adoption.
However, immediate progress in the Senate has stalled due to disputes between banking lobbyists and the crypto industry regarding stablecoin yield structures. Despite these headwinds, Ripple CEO Brad Garlinghouse publicly stated he sees an 80% probability of the bill passing by the end of April, keeping hope alive for a regulatory breakthrough in Q2.
7. Institutional Activity: Nvidia, Grayscale, and New Products
Beyond ETF flows, institutional activity signaled continued integration of crypto into traditional finance:
- Nvidia Earnings: The tech giant’s earnings beat on Feb 26 provided a macro “risk-on” tailwind that correlated tightly with Bitcoin’s surge to $70K.
- Grayscale Analysis: A new report from Grayscale highlighted that Bitcoin is currently trading with a higher correlation to tech stocks than gold, temporarily losing its “safe haven” narrative.
- Kraken Flexline: The exchange launched a new product allowing users to borrow against their staked assets, increasing capital efficiency for sophisticated traders.
- Sell Pressure: Offsetting these positives, GD Culture announced the board-approved liquidation of 7,500 BTC (~$510M), creating a known supply overhang that capped upside momentum.
8. Technical Analysis: Key Levels for March 2026
As we enter March, traders should monitor these pivotal technical levels. Bitcoin remains range-bound, and a breakout in either direction will likely dictate the trend for the entire month.
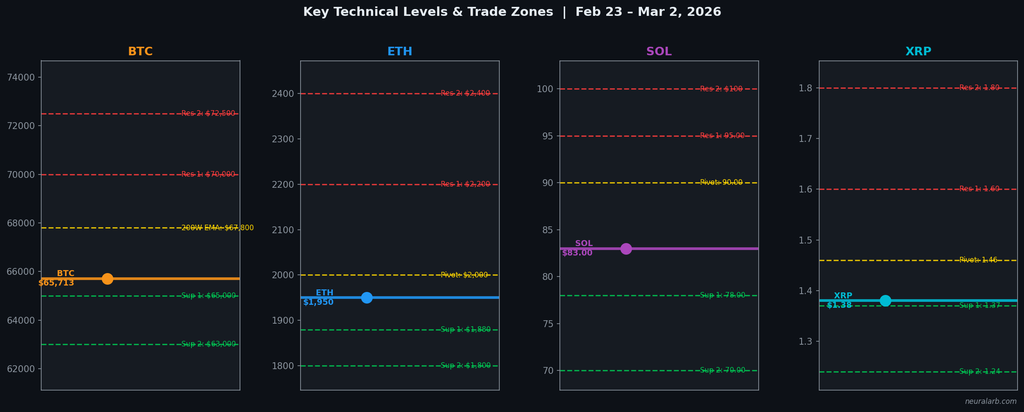
- Bitcoin (BTC):
- Support: $65,200 (Weekly VWAP), $63,000 (Major Structural Support)
- Resistance: $70,000 (Psychological), $72,500 (200-Day MA), $75,000 (Option Wall)
- RSI: 42 (Neutral, recovering from oversold)
- Bitcoin (BTC):
-
- Ethereum (ETH):
- Support: $1,950, $1,880
- Resistance: $2,200, $2,400
- Ethereum (ETH):
-
- Solana (SOL):
- Support: $78, $70
- Resistance: $95, $100
- Solana (SOL):
-
- XRP:
- Critical Support: $1.37 (Must Hold)
- XRP:
9. Geopolitical Risk Factor: US-Israel Iran Strikes
The late week sell off was exacerbated by renewed geopolitical instability. Airstrikes involving US and Israeli forces in Iran on February 27–28 triggered a “flight to safety” across global markets. While gold surged, Bitcoin reacted as a risk asset, shedding 3% in hours.
This reaction underscores the current fragility of the crypto market. Until Bitcoin recouples with its “digital gold” narrative, geopolitical escalations are likely to serve as headwinds rather than tailwinds for price action.
10. Options Expiry Analysis: 115K BTC Contracts
February concluded with a massive monthly options expiry on the 28th. Approximately 115,000 Bitcoin contracts with a notional value of $7.49 billion expired. The “max pain” price the level at which the most options expire worthless was $75,000, significantly higher than the spot price.
The expiry passed without major volatility, but the removal of this open interest resets the board for March. Dealer positioning had been light, which allowed the spot price to drift lower without aggressive defense of key strikes.
11. Arbitrage Opportunities During Extreme Fear
Periods of extreme fear and high volatility create the most lucrative environments for algorithmic arbitrage trading. When panic selling occurs, price discrepancies across exchanges widen significantly before normalizing.
NeuralArB Opportunity Radar: 6 Strategies for Volatile Markets
During this week’s 5-11 Fear Index readings, our AI identified and executed on six specific types of arbitrage:
- CEX-CEX Spreads: Widening gaps between Binance and Coinbase during flash crashes.
- Funding Rate Arb: Capturing yields from negative funding rates on perp swaps.
- ETF Arbitrage: Exploiting NAV premiums/discounts on IBIT and GBTC vs. spot BTC.
- Altcoin Basis Trades: Profiting from the difference between futures and spot prices on volatile assets like DOT.
- Liquidation Cascades: Automated buying on exchanges suffering deeper wicks due to thin liquidity.
- Stablecoin Depegs: Micro-arbitrage on USDT/USDC pairs during stress tests.
12. Week Ahead Outlook: Key Catalysts March 3-9
Looking ahead, the market enters March with cautious optimism supported by ETF flows but capped by macro risks. Key events to watch include:
- Polkadot Halving (Mar 14): Expect continued volatility and speculation in DOT leading up to the event next week.
- Fed Speakers: Multiple Federal Reserve officials are scheduled to speak, potentially offering clues on interest rate policy impacting risk assets.
- ETF Momentum: Will the inflow streak continue? Sustained flows are needed to break the $70K resistance.
- Technical Test: A second test of $70K is likely if macro conditions remain stable; failure would re-target $63K support.
13. Data & Charts Gallery
Visualizing the market’s complex movements provides clarity. Review our exclusive charts generated for this week’s analysis.
14. Downloadable Market Data
For analysts, traders, and researchers, we provide the complete raw data used in this report. Access daily price OHLC, volume, ETF flows, and sentiment data in a clean CSV format.
Conclusion & Trading Recommendations
The week of February 23 to March 2, 2026, served as a potent reminder that in crypto, price is the only truth. Despite extreme fear and geopolitical headwinds, Bitcoin staged a formidable recovery, backed for the first time in weeks by real institutional capital flows via ETFs. However, the failure to reclaim $70,000 indicates that the market remains fragile and range bound.
For traders, the environment favors tactical agility. The rotation into idiosyncratic plays like Polkadot shows that capital is seeking alpha beyond the majors. With macro risks persisting, maintaining strict risk management and utilizing automated tools to capture volatility remains the optimal strategy.
💬 Frequently Asked Questions (FAQ)
Why did Bitcoin rally to $70K on February 26, 2026?
Bitcoin surged 9% from $63,924 to briefly test $70,000 on February 26, 2026, driven by a short squeeze following Bitcoin ETF inflows of $506.5 million on February 25, the largest single day inflow in three weeks. The rally was technical rather than fundamental, triggered by overcrowded short positions in futures markets and risk on sentiment from Nvidia‘s earnings beat. However, BTC failed to hold $70K and pulled back to $65,500-$66,000 range by March 2 amid renewed geopolitical risk from US-Israel airstrikes on Iran.
What happened with Bitcoin ETF flows during Feb 23 - Mar 2, 2026?
Bitcoin spot ETFs reversed a 6-week bleeding streak during this period. After opening with -$119.7M outflows on Feb 23, ETFs saw three consecutive days of strong inflows: +$80.8M (Feb 24), +$506.5M (Feb 25 – led by BlackRock’s IBIT at $297M), and +$269.4M (Feb 26), totaling $1.1 billion over 3 days. This marked the strongest weekly performance in over a month. By week’s end, total net weekly inflows reached approximately $834 million, signaling a potential shift in institutional sentiment despite persistent Extreme Fear readings.
Why didn't Trump mention crypto in his State of the Union address?
President Trump’s February 24, 2026 State of the Union address — the longest SOTU in history — did not mention cryptocurrencies, blockchain, or digital assets despite being a pro crypto administration. Bitcoin rallied ahead of the speech on speculation but experienced a classic ‘sell the news’ pullback afterward. The omission suggests crypto policy is being handled through executive orders, regulatory agency appointments (like SEC Chair Mark Uyeda), and pending legislation (CLARITY Act) rather than headline presidential speeches.
What is the CLARITY Act and when will it pass?
The Digital Asset Market CLARITY Act is proposed U.S. legislation that would establish a clear regulatory framework splitting oversight between the SEC (securities) and CFTC (commodities). On February 28, 2026, JPMorgan analysts predicted the bill could pass by mid-year 2026 and serve as a positive catalyst for crypto markets in H2. The White House held its second meeting on stablecoin yield provisions on February 20, but Senate progress has stalled due to disputes between traditional banking interests and crypto industry over stablecoin reward structures.
Why did Polkadot (DOT) surge 28.6% this week?
Polkadot (DOT) massively outperformed all major crypto assets during Feb 23 – Mar 2, 2026, rallying 28.6% from $5.20 to $6.69. The surge was triggered by the announcement of a planned halving event scheduled for March 14, 2026, with a supply cap set at 2.1 billion DOT. This supply reduction mechanism similar to Bitcoin’s halving creates scarcity and typically drives speculative demand ahead of the event. DOT was the week’s best performer, significantly ahead of BTC (+1.5%), ETH (-0.8%), SOL (-1.2%), and XRP (-4.1%).
What are the key support and resistance levels for Bitcoin in March 2026?
As of March 2, 2026, Bitcoin’s critical technical levels are:
Support: $65,200 (immediate), $63,000 (major — Feb 23 low), $60,000 (structural).
Resistance: $70,000 (tested and rejected Feb 26), $72,500 (200-day moving average), $75,000 (options max pain level for Feb 28 expiry).
Bitcoin’s RSI at ~42 indicates neutral conditions recovering from oversold. A sustained break and close above $70,000 is required to confirm bullish momentum; failure to hold $63,000 opens downside toward $60K.
Is the crypto Fear & Greed Index still in Extreme Fear despite the rally?
Yes. The Crypto Fear & Greed Index remained in Extreme Fear throughout the entire Feb 23 – Mar 2 rally period, ranging between 5-11 out of 100. Despite the market cap increasing $150 billion (from $2.29T to $2.44T peak on Feb 26), and Bitcoin bouncing 9%, sentiment indicators did not improve. This paradox — price rallying while fear persists — suggests the move was primarily a technical short squeeze rather than fundamental buying conviction. Historically, sustained bull markets require the Fear & Greed Index to break above 25.
 Stay Connected:
 Related Analysis:
How High-Frequency Trading (HFT) (Impacts Crypto Arbitrage)
- Reinforcement Learning in Dynamic Markets (AI trading strategies)
- Crypto Arbitrage 101 (beginner’s guide to arbitrage)
Data Sources:
- CoinGecko – Real-time price data and market cap
- Yahoo Finance – Historical price data
- CoinDesk – Liquidation data
- Reuters – Market analysis
- Binance – Upcoming catalysts
Disclaimer: This analysis is for educational purposes. Arbitrage trading involves substantial risk, including custody risk, regulatory risk, and execution risk. Past performance is not indicative of future results. Never risk capital you cannot afford to lose. Consult qualified financial and legal advisors before trading.