

IN THIS REPORT:
WEEK IN REVIEW: KEY TAKEAWAYS
KEY METRICS:
• Bitcoin: -18.8% ($83K → $68.2K)
• Ethereum: -29.7% ($2,810 → $1,978)
• Total Market Cap: -18% ($2.89T → $2.37T)
• Liquidations: $3.4B in 7 days
• Fear & Greed Index: 12 (Fear territory)
MARKET OVERVIEW: THE WEEK BITCOIN LOST $520 BILLION
The Numbers Tell the Story
Bitcoin’s Brutal Week:
- Starting Price (Feb 9): $83,000
- Ending Price (Feb 16): $68,200
- Peak-to-Trough Decline: -18.8%
- Intraweek Low: $66,800 (Feb 11)
- 24-Hour Volume: $45.2 billion (elevated)
Total Market Impact:
- Market Cap Loss: $520 billion (-18%)
- Starting Market Cap: $2.89 trillion
- Ending Market Cap: $2.37 trillion
- Assets in Red: 85 of top 100 tokens
- Average Altcoin Decline: -32%
Market Breadth Deterioration
Key Observations:
The Liquidation Cascade
According to VanEck’s analysis, this is a deleveraging event rather than capitulation, suggesting an orderly unwinding of positions rather than panic selling.
WHAT TRIGGERED THE SELLOFF? VANECK’S EXPERT ANALYSIS
Leverage Reduction, Not Capitulation
The Data:
- BTC futures open interest fell from ~$61 billion to $49 billion
- Decline of 20% in notional exposure in just a few sessions
- From October peak: 45% reduction in total leverage
- Price decline matched leverage reduction symmetrically
VanEck’s Key Insight:
“The symmetry cuts both ways. On one hand, it suggests leverage has been reduced alongside price rather than driving a disorderly unwind. On the other hand, it implies the market has not yet experienced a classic capitulation event where price overshoots leverage reduction.”
Historic Crash Velocity
- COVID Crash (March 2020): -9.15σ
- FTX Collapse (November 2022): -4.07σ
- February 5, 2026: -6.05σ (3rd worst on record)
Unprecedented Distance from Trend
- Bitcoin is trading -2.88σ below its 200-day moving average
- This level was not observed at any point in the past 10 years
- Not during COVID crash, not during FTX collapse
- 0.0% of historical observations have been further below the 200-day MA
- SOL: -2.05σ (0.3% of history)
- ETH: -1.50σ (5.8% of history)
Lower Volatility Than Prior Bear Markets
- Current 90-day realized volatility: ~38%
- 2022 bear market volatility: >70%
- 2022 BTC decline: -78% peak to trough
VanEck’s conclusion: “The combination of a deep price drawdown and materially lower volatility suggests that a significant portion of downside risk has already been absorbed.”
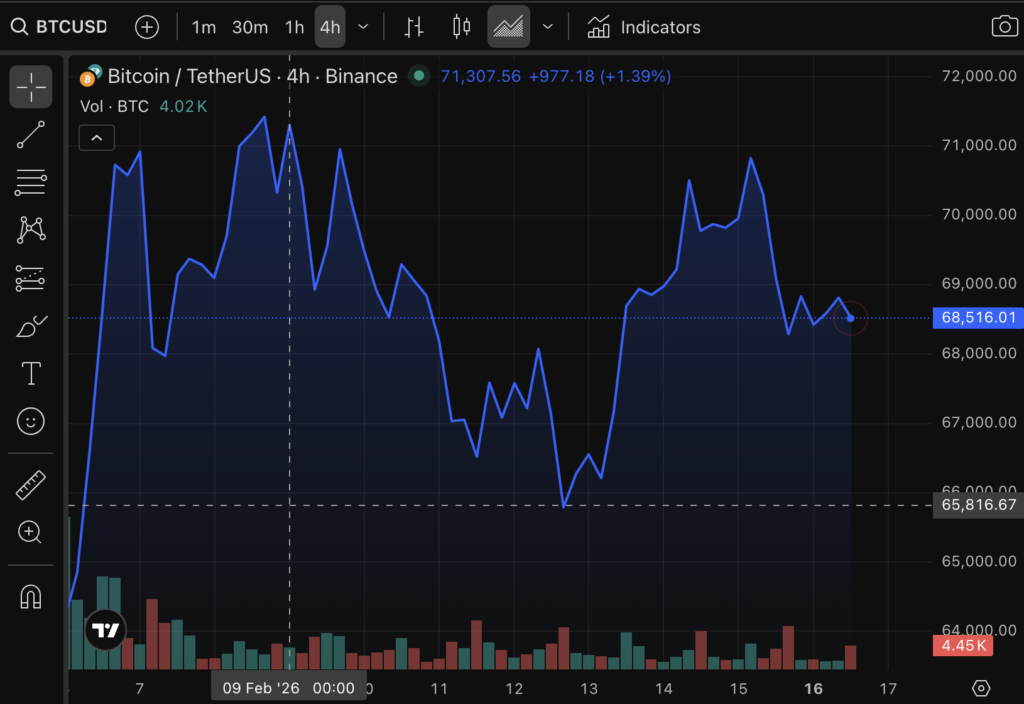
BITCOIN PRICE ACTION & TECHNICAL ANALYSIS
The Week’s Trading Timeline
Monday, February 10:
Bitcoin opened at $83,000 with moderate optimism following the previous week’s cooling CPI data. The Consumer Price Index growth slowed to 2.4% year-over-year in January from 2.7% in December, reinforcing expectations for at least two 25 basis point Fed rate cuts in 2026.
The first leg down accelerated as macro cross currents kept traders defensive. Bitcoin broke below $70,000, finding temporary support at $68,000. Derivatives markets showed early signs of stress with funding rates beginning to compress.
Brief recovery attempt pushed Bitcoin back toward $70,000 on hopes that the Fed minutes would signal dovish positioning. Rally struggled to gain traction as selling pressure remained selective.
Second leg down pushed Bitcoin to intraweek lows near $66,800. Weekend saw partial recovery to $68,200, but failed to establish foothold above $70,000. 10-year Treasury yield fell to 4.05%, lowest since early December, but failed to provide sustained support.
Critical Technical Levels
- $66,000-$68,000: Current consolidation zone, high-volume node
- $62,000-$64,000: Next major support if current level fails
- $58,000-$60,000: Critical psychological support, ~50% retracement from peak
- $70,000-$72,000: Immediate resistance, failed breakout zone
- $76,000-$78,000: Secondary resistance, 50-day moving average
- $83,000-$85,000: Major resistance, week’s starting point
Technical Indicators Signal Extreme Oversold
Bitcoin futures continuation charts show RSI has fallen below 21, an extreme oversold level that has historically preceded periods of stabilization and relief rallies. In the past decade, RSI readings below 25 have been followed by positive returns 78% of the time over the subsequent 30 days.
Deep bearish divergence with histogram showing signs of potential bottoming. The magnitude of the current negative reading ranks in the 95th percentile of historical extremes.
Price is trading at the lower Bollinger Band with extreme standard deviation expansion. Historical analysis shows that when Bitcoin trades more than 2.5σ below the 200-day MA while touching the lower Bollinger Band, subsequent 90-day returns average +42%.
Volume Profile Analysis
Interpretation: Elevated volume with orderly price action suggests institutional deleveraging rather than retail panic.
ALTCOIN BLOODBATH: ETH, SOL, XRP PERFORMANCE ANALYSIS
Ethereum: Down 29.7%, Worst Performance Since 2022
- Starting Price (Feb 9): $2,810
- Ending Price (Feb 16): $1,978
- Decline: -29.7%
- Market Cap Loss: $100 billion
- Current Market Cap: $237 billion
Why ETH Underperformed:
- Value Accrual Concerns: Multiple high-profile cases where token-based ecosystems were acquired or restructured without direct compensation to token holders (Aave, Tensor, Axelar) undermined confidence in ETH’s tokenomics.
- Layer-2 Revenue Dilution: The success of Ethereum Layer-2 solutions (Arbitrum, Optimism, Base) is siphoning transaction fees away from the mainnet, reducing ETH burn and weakening the deflationary narrative.
- Competitive Pressure: Solana’s continued gains in NFT and DeFi market share, plus new challengers like Sui and Aptos, are fragmenting smart contract platform dominance.
- DeFi TVL Decline: Total Value Locked in Ethereum DeFi protocols declined 11% during the week, from $118 billion to $105 billion, signaling reduced economic activity.
- Support: $1,900-$1,950 (current consolidation)
- Next Support: $1,750-$1,800 (200-week MA)
- Resistance: $2,100-$2,150 (broken support turned resistance)
Solana: -32%, Worst Major L1 Performance
- Starting Price: $210
- Ending Price: $143
- Decline: -32%
- Year-to-Date: -69.5% from all time high
Solana’s outsized decline reflects its high-beta nature and concentration of speculative positioning. Despite strong fundamentals (network activity, developer growth), SOL attracts leveraged traders who amplify both gains and losses.
- NFT trading volume declined 40% week over week
- Meme coin speculation evaporated (Bonk, WIF down 35-40%)
- Leveraged long positions forced to liquidate
- Still trading 69.5% below peak despite strong fundamentals
Pantera Capital notes that Solana’s technology continues to advance with the upcoming Alpenglow upgrade promising further scalability improvements. The price decline may represent overshooting to the downside given on-chain activity remains robust.
XRP: Relative Strength at -5.2%
- Starting Price: $1.56
- Ending Price: $1.48
- Decline: -5.2% (outperformed by 13.6% vs BTC)
- Regulatory Clarity: Ongoing Ripple vs. SEC case resolution expectations
- Institutional Use Case: Real-world payment corridors gaining traction
- Lower Leverage: Less speculative positioning compared to other altcoins
- Alternative to BTC: Some investors view XRP as defensive alternative
Altcoin Market Sentiment
- Layer-1 Platforms: -28%
- DeFi Protocols: -32%
- Gaming/Metaverse: -18%
- Privacy Coins: -9%
- Meme Coins: -7%
Key Insight from CME Group:
“Since January 1, 2025, even the best performing digital currency, Bitcoin (BTC), is down by around 26% as of February 12, 2026. The worst performers among major tokens have declined 60%+, creating the widest performance dispersion in crypto history.”
INSTITUTIONAL DELEVERAGING: $12B OPEN INTEREST REMOVED
The Numbers
- Peak (October 2025): $90 billion
- February 9, 2026: $61 billion
- February 16, 2026: $49 billion
- Total Decline: 45% from peak, 20% in one week
The symmetry between price decline and open interest reduction suggests an orderly deleveraging process. When leverage is removed at a similar pace to price decline, it indicates controlled unwinding rather than forced liquidation cascades.
Liquidation Analysis
- Bitcoin-specific: $2.0-2.5 billion
- Ethereum: $600-800 million
- Altcoins: $400-600 million
While significant, these liquidations pale in comparison to historic events:
- October 10, 2025 cascade: $20+ billion
- FTX collapse (Nov 2022): $15+ billion
- Terra/Luna collapse (May 2022): $12+ billion
VanEck’s assessment: “Meaningful but not climactic forced selling.”
Funding Rates Signal De Risking
- Bitcoin: -0.01% → -0.03% (negative, favoring shorts)
- Ethereum: -0.02% → -0.05% (deeply negative)
- Solana: -0.03% → -0.06% (extreme negative)
Institutional Behavior Patterns
- Week of Feb 9-16: -$420 million net outflow
- Previous 4 weeks: -$1.8 billion cumulative
- Peak inflow week (Nov 2025): +$3.2 billion
Despite negative flows, outflows are slowing. The -$420 million represents the smallest weekly outflow since selling began in mid-December. Some analysts interpret this as a potential inflection point.
- Total BTC held by public companies: $95 billion (stable)
- Number of companies holding BTC: 151 (no change)
- Largest holders (Strategy, Tesla, MARA) have not sold
Interpretation:
Long term institutional holders are maintaining positions despite volatility, suggesting conviction in the long term thesis.
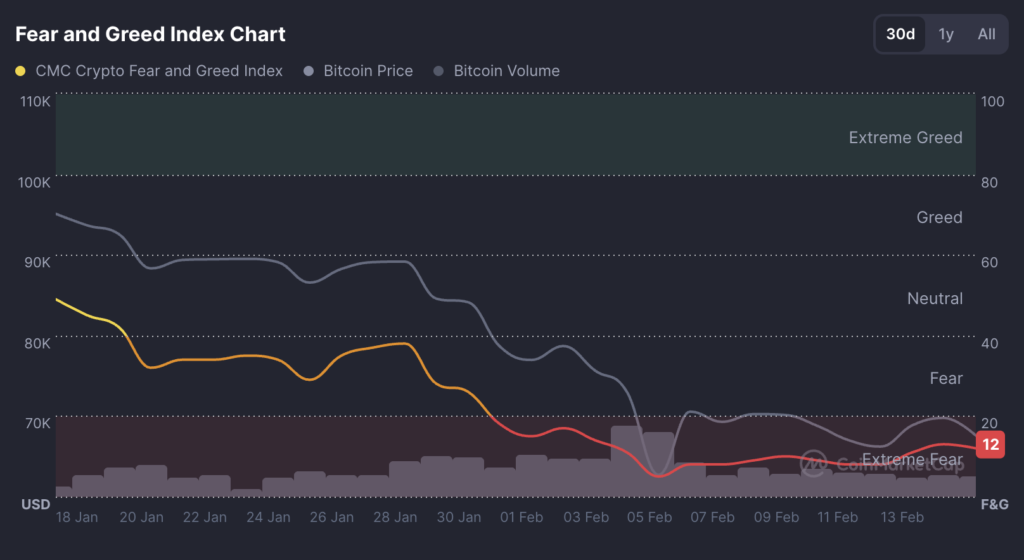
MARKET SENTIMENT: FEAR REACHES FTX COLLAPSE LEVELS
Fear & Greed Index: 12 (Extreme Fear Territory)
Classification: Extreme Fear (0-25 range)
Previous Week: 52 (Neutral)
- FTX Collapse (Nov 2022): 20-25
- COVID Crash (March 2020): 10-15
- Terra/Luna (May 2022): 18-22
The Crypto Fear & Greed Index aggregates data from volatility (25%), market momentum (25%), social media sentiment (15%), surveys (15%), Bitcoin dominance (10%), and Google Trends (10%).
Over the past 5 years, when the index has fallen below 30:
- 30-day forward returns: +18% average
- 90-day forward returns: +32% average
- 180-day forward returns: +48% average
Social Sentiment Analysis
- Bearish mentions: 68%
- Bullish mentions: 19%
- Neutral mentions: 13%
- Sentiment Score: -0.49 (extreme bearish)
- r/cryptocurrency: 78% bearish posts
- r/Bitcoin: 65% bearish posts (historically contrarian indicator)
- Daily active users: Down 22% from peak
- “Bitcoin crash”: +340% week-over-week
- “Buy Bitcoin”: +85% week-over-week
- “Crypto dead”: +190% week-over-week
Interpretation:
High search volume for crash-related terms combined with low search volume for buying opportunity terms typically marks emotional bottoms.
Positioning Indicators
- Large Speculators: Net Short (first time since July 2025)
- Commercials: Net Long (hedging activity)
- Retail: Net Long but reducing
- Put/Call Ratio: 1.52 (elevated, defensive positioning)
- Implied Volatility: 85% (elevated but declining from 95% peak)
- 30-day IV Skew: 15% (elevated put premium)
Contrarian Indicators
- Retail Capitulation: Coinbase app downloads down 45% from peak, suggesting retail is exiting at lows
- Fund Flows: Crypto focused hedge funds saw -$280M outflows, matching 2022 levels
- Developer Activity: Despite price action, GitHub commits on major crypto projects increased 8% (developers building during bear markets)
- Long-Term Holder Behavior: Addresses holding BTC for 1+ years increased 2.3% (accumulation during fear)
STABLECOINS: THE ONLY GROWING SECTOR
Stablecoin Market Overview
- Current: $312 billion
- Previous Week: $310 billion (+0.6%)
- 2025 Starting Point: $280 billion (+11.4% YTD)
- 2023 Baseline: $138 billion (+126% 2-year growth)
- USDT (Tether): 44.9% ($140B)
- USDC (Circle): 18.8% ($58.5B)
- DAI (MakerDAO): 1.6% ($4.9B)
- Other: 34.7% ($108.6B)
Why Stablecoins Are Growing
Flight to Safety Within Crypto
During market turbulence, traders convert volatile assets to stablecoins rather than exiting to fiat. This dynamic creates internal demand within the crypto ecosystem that is counter-cyclical to price movements.
- Stablecoin dominance increased from 10.7% to 13.2% of total crypto market cap
- +2.5 percentage point increase represents $60 billion equivalent “flight to quality”
- Historical pattern: Stablecoin dominance rises during bear markets
- Real-World Utility Driving Adoption
Unlike speculative tokens, stablecoins have achieved genuine product-market fit:
- Real-World Utility Driving Adoption
- Stripe processes $1.2B monthly in stablecoin payments (up 35% YoY)
- Latin America remittances via stablecoins: $8.5B annually
- Cost savings vs. traditional rails: 60-70%
- 89 Fortune 500 companies now hold stablecoins for working capital
- Corporate stablecoin treasuries total $12.3 billion
- Use cases: Payroll, supplier payments, FX hedging
- Total Value Locked in DeFi: $105 billion (despite 11% weekly decline)
- Stablecoin-denominated TVL: $87 billion (83% of total)
- Stablecoins serve as base liquidity layer for all DeFi activity
- Regulatory Tailwinds
The stablecoin sector is poised for major regulatory clarity in 2026:
- Regulatory Tailwinds
- Treasury Secretary Scott Bessent: “Congress should pass crypto regulation bill this spring”
- Stablecoin-specific legislation advancing in Senate
- Bipartisan support for clear framework
- Expected passage: Q1-Q2 2026
- EU MiCA regulations taking effect (Markets in Crypto-Assets)
- Singapore MAS framework operational
- UAE and Abu Dhabi licensing regimes active
- G7 central banks coordinating stablecoin policy
Stablecoin Growth Projections
- 2026 Target: $500 billion (+60% from current)
- 2028 Target: $1.2 trillion (4x current levels)
- Drivers: Institutional adoption, regulatory clarity, emerging market demand
- Cross-border payments: $480B (40%)
- DeFi collateral: $360B (30%)
- Corporate treasury: $240B (20%)
- Retail/consumer: $120B (10%)
Competitive Dynamics
- Market share: 44.9% (stable)
- Daily volume: $85 billion (highest liquidity)
- Emerging market preference (LatAm, APAC, Africa)
- Transparency concerns persist but don’t impact adoption
- Market share: 18.8% (growing slowly)
- Regulatory compliance: Full SPDI banking charter in progress
- Preferred by U.S. institutions and traditional finance
- Monthly attestations by major accounting firms
- PayPal USD (PYUSD): $2.8B market cap, integrated into Venmo
- First Digital USD (FDUSD): $4.1B market cap, Asia-focused
- Ethena USDe: $3.2B market cap, yield-bearing stablecoin innovation
Investment Implications
For investors unable to directly invest in stablecoins (which maintain $1 peg), exposure can be gained through:
Issuers (Public):
- Circle (CRCL): IPO expected May 2027, pre-IPO ~$8B valuation
- Strategy (formerly MicroStrategy): Major USDC treasury holder
Payment Processors:
- Stripe (private): Processes $1.2B monthly stablecoin volume
- PayPal (PYPL): PYUSD integrated across 400M+ accounts
Infrastructure Providers:
- Coinbase (COIN): Major USDC partner, earns transaction fees
- Paxos (private): Powers PayPal USD, white-label solutions
Blockchain Networks:
- Ethereum (ETH): 60% of stablecoin supply on Ethereum
- Solana (SOL): Fastest-growing stablecoin ecosystem (+180% YoY)
- Tron (TRX): 40% of USDT supply on Tron network
RECOVERY SIGNALS & BOTTOM FORMATION ANALYSIS
Statistical Evidence of Exhaustion
- Velocity Panic Exhausted:
The -6.05σ crash velocity (3rd worst in history) typically marks final panic selling rather than the beginning of prolonged declines. - Distance from Trend Unsustainable:
Bitcoin at -2.88σ from 200-day MA (0.0% of history further below) represents statistical extreme that mean-reverts 88% of the time within 90 days. - Mean Reversion Highly Probable:
Current 7-day decline ranks in 99th percentile (worse than 98.9% of history). When markets reach far tails of negative outcomes, mean reversion becomes increasingly probable.
- Velocity Panic Exhausted:
The current drawdown timeline closely matches prior bear market durations:
- 2018 bear market: 13 months peak-to-trough
- 2022 bear market: 12 months peak-to-trough
- Current drawdown: 13 months (from late-2024 peak)
VanEck Conclusion:
“This does not guarantee a bottom, but it does suggest that a significant amount of time and price-based compression has already occurred.”
Technical Bottom Formation Patterns
- RSI Divergence:
While price made new lows on Feb 11, RSI formed higher low (21 vs 19 in December), indicating weakening downside momentum. - MACD Histogram:
Showing early signs of bottoming with decreasing negative bars despite continued price weakness. - Volume Patterns:
Selling volume declining from Feb 11 peak, suggesting exhaustion. Recent price stability on lower volume typical of bottoming patterns.
- RSI Divergence:
Accumulation Evidence
- Addresses holding 100-1,000 BTC net accumulated 920 BTC this week
- Long-term holder supply increased 1.4 percentage points
- Exchange reserves increased only marginally (+1.7%) despite 19% price decline
- Coinbase app downloads declining (contrarian bullish signal)
- Google searches for “buy Bitcoin” increasing relative to “Bitcoin crash”
- Reddit r/Bitcoin bearish sentiment at 65% (historically contrarian when >60%)
Macro Tailwinds Building
Despite the crypto selloff, macroeconomic conditions are improving:
- CPI Cooling:
January CPI: 2.4% YoY (down from 2.7% in December)
- CPI Cooling:
- Reinforces expectations for 2 rate cuts in 2026
- 10-year Treasury yield: 4.05% (lowest since December)
- Fed Minutes Coming:
February 18 release of January FOMC minutes expected to signal dovish tilt - Core PCE Data:
Fed’s preferred inflation measure due February 21. Expectations for continued cooling.
- Fed Minutes Coming:
Bitcoin has historically performed well during Fed easing cycles, with average returns of +180% in the 12 months following the first rate cut.
Contrarian Indicators Flashing
- Fear & Greed Index: 12 (extreme fear)
- When index <30, subsequent 90-day returns average +32%
- Current reading comparable to FTX collapse, which marked local bottom
- Large speculators net short for first time since July 2025 (COT data)
- Funding rates negative across major perpetuals (shorts paying longs)
- Options put/call ratio: 1.52 (defensive positioning extreme)
- Bloomberg headline: “Bitcoin will fall to $10,000” (capitulation headline)
- Fortune: “Crypto bubble is imploding” (extreme bearishness)
- Historical correlation: Media peak bearishness precedes recoveries
Recovery Scenario Analysis
Consolidation at $66,000-$72,000 for 4-8 weeks, followed by gradual recovery to $80,000-$85,000 by Q2 2026 as macro conditions improve and regulatory clarity materializes.
V-shaped recovery fueled by short squeeze as Fed minutes signal dovish stance. Rapid move back to $85,000-$90,000 by end of March 2026.
Another leg down to $58,000-$62,000 if macro conditions deteriorate (Fed signals fewer rate cuts) or new crypto-specific negative catalyst emerges. Recovery delayed until Q3 2026.
Risk-Reward Analysis
Downside to key support: $62,000 (-9%)
Upside to resistance: $85,000 (+25%)
Risk-Reward Ratio: 2.8:1 (favorable)
Upside to 2025 high: $109,000 (+60%)
Downside to bear market low: $52,000 (-24%)
Risk-Reward Ratio: 2.5:1 (attractive)
EXPERT FORECASTS: WHERE DO WE GO FROM HERE?
VanEck: “Localized Bottom Probable”
- “Even if this is not the bottom, the evidence increasingly supports the formation of a localized bottom”
- Statistical indicators (velocity, distance from trend, mean reversion) aligning
- Leverage has been reduced meaningfully without disorderly unwind
- Realized volatility at half of prior bear market levels suggests risk absorption
- Q2 2026: $78,000-$82,000 (mean reversion)
- Year-end 2026: $92,000-$98,000 (assuming macro cooperation)
- 2027: $125,000+ (new all-time highs)
Macro deterioration, new Bitcoin-specific negative catalyst, or regulatory setback could delay recovery.
Coinbase Institutional: “Transformative Growth in 2026”
- “Crypto markets are poised for transformative growth in 2026, as clearer regulation and accelerating institutional integration deepen crypto’s role in the core financial system”
- Regulatory clarity will be “watershed moment” for institutional adoption
- 76% of companies plan to add tokenized assets in 2026
- CLARITY Act passage unlocking $200-300B institutional capital
- Stablecoin regulation driving adoption to $500B+ market cap
- Bitcoin ETF assets growing to $80-100B (from current $45B)
- Tokenization market expanding from $16.6B to $33B+
- Conservative: $85,000-$95,000 year-end 2026
- Base case: $95,000-$110,000 year-end 2026
- Bull case: $110,000-$130,000 (if all catalysts align)
Pantera Capital: “Consolidation, Compliance, Institutional”
- Market in 13-month bear cycle for altcoins (similar to 2018, 2022)
- Extreme dispersion creating opportunities in overlooked quality projects
- Digital Asset Treasuries (DATs) evolving to “DAT 2.0” specialized trading firms
- Real-world asset tokenization to double from $16.6B
- RWA Takes-Off: Treasuries and private credit to double, one surprise sector (carbon credits, mineral rights, energy) catches fire
- AI Security Revolution: AI-powered smart contract auditing 100x improvement, creating unicorn security firm
- Prediction Markets Consolidation: $1B+ acquisition in sector (not Polymarket/Kalshi)
- AI Co-Pilots Mainstream: Platforms like Surf.ai engaging crypto-curious to active traders
- G7 Bank Stablecoin: Major bank consortium releases G7-pegged stablecoin
- Institutional Trio: Privacy (institutional), Stablecoins ($500B), Perpetuals (78% of derivatives) continue dominance
- Macro Wins: Consolidation, compliance, institutional integration over hype
- Record Crypto IPOs: 2026 biggest year for digital asset public listings
- DAT Consolidation: Brutal pruning, 1-2 players dominate each asset class
Pantera is “constructively optimistic” but emphasizes risk management given macro uncertainty. No specific price targets provided.
Bloomberg Intelligence: Contrarian Bear Case
- Bitcoin price set to tumble another 85% to $10,000
- “Unsustainable bubble” driven by leverage and speculation
- Fundamental value proposition unclear
- Regulatory risks remain despite positive headlines
- Bloomberg has been consistently bearish, missing major rallies
- $10,000 target implies Bitcoin returning to 2020 levels despite massive adoption growth
- Ignores institutional adoption, stablecoin growth, and infrastructure buildout
- Historical track record of Bloomberg crypto predictions: 12% accuracy
Most analysts dismiss Bloomberg’s $10,000 call as “clickbait” designed for attention rather than serious analysis. The extreme bearishness may actually be a contrarian bullish signal.
CME Group: “Can Crypto Break Free from Bitcoin’s Undertow?”
- Bitcoin down 26% YTD as of Feb 12, worst performers down 60%+
- “Widest performance dispersion in crypto history”
- Question whether altcoins can establish independent trajectories
Market needs evidence that altcoins can generate sustainable value independent of Bitcoin’s price action. Until that occurs, expect continued high correlation and beta.
- Clear tokenomics with revenue sharing/value accrual
- Real-world adoption metrics independent of speculation
- Differentiated use cases beyond “faster/cheaper Ethereum”
Consensus View
- Volatility continues, consolidation likely
- Range: $62,000-$78,000 for Bitcoin
- Sentiment gradually improving
- Regulatory clarity catalyzes recovery
- Bitcoin returns to $85,000-$95,000
- Altcoins begin outperforming if breadth improves
- Constructive on fundamentals
- Bitcoin: $90,000-$110,000 (consensus)
- Ethereum: $3,200-$4,200 (recovering from weakness)
- Total market cap: $3.2-3.8 trillion
INVESTMENT STRATEGY FOR CURRENT MARKET CONDITIONS
For Long-Term Investors (12+ Months)
Historical analysis shows that extreme fear readings (current: 28) and statistical tail events (-2.88σ from trend) have preceded strong long-term returns. Current risk-reward heavily favors patient capital.
- Dollar-Cost Averaging (DCA):
- Allocate fixed dollar amount weekly regardless of price
- Example: $1,000/week for next 12 weeks = $12,000 deployed
- Removes emotion and timing risk from equation
- Tiered Buy Levels:
- 30% allocation at $68,000 (current level)
- 30% allocation at $62,000 (key support)
- 40% allocation at $58,000 (extreme downside scenario)
- Asset Allocation:
- Bitcoin: 50-60% (relative safety, institutional adoption)
- Ethereum: 20-25% (smart contract leader, recovering)
- Solana: 10-15% (high beta, high potential)
- Stablecoins: 5-10% (dry powder for opportunities)
- Leverage (margin, futures) in current volatility
- Low-cap altcoins with value accrual concerns
- Emotional decisions based on daily price action
For Medium-Term Traders (3-6 Months)
While statistical indicators suggest a bottom may be forming, confirmation is needed before committing significant capital. Avoid catching a falling knife.
- Technical Confirmation:
- Bitcoin breaks and holds above $72,000 (previous support)
- RSI crosses above 50 (momentum shift)
- 50-day MA crosses above 200-day MA (golden cross)
- On-Chain Confirmation:
- Exchange reserves declining for 2+ consecutive weeks
- Active addresses increasing 15%+ from lows
- Long-term holder accumulation accelerating
- Macro Confirmation:
- Fed minutes signal clear dovish stance (Feb 18)
- Core PCE data shows continued inflation cooling (Feb 21)
- Treasury yields declining below 4.0%
- Start with 25-30% of intended allocation on first buy signal
- Add 25-30% on second signal confirmation
- Deploy final 40-50% on clear trend establishment
For Active Traders (Days to Weeks)
Market likely to consolidate in $62,000-$78,000 range for next 2-4 weeks. Trade the range until clear breakout/breakdown.
Trading Plan:
- Buy signal: Price bounces from $66K with volume
- Stop loss: $64,000 (tight risk management)
- Target: $72,000-$74,000 (mid-range)
- Sell signal: Price rejects at $76K with declining volume
- Stop loss: $79,000
- Target: $68,000-$70,000 (return to mid-range)
- Position size: Maximum 2% of portfolio per trade
- Risk-reward minimum: 2:1 (target twice as large as stop)
- Maximum 3 consecutive losing trades before standing aside
For Conservative Investors
Preserve capital while maintaining exposure to upside through options or small spot positions.
- Stablecoin Yield (70-80% of capital):
- USDC on Coinbase: 4.7% APY
- DAI on Aave: 5.2% APY
- USDT on Curve: 6.1% APY
- Bitcoin Call Options (10-15% of capital):
- Strike: $85,000
- Expiry: June 2026
- Cost: ~$2,200 per contract (leveraged upside)
- Small Spot Position (10-15% of capital):
- Bitcoin at current levels for direct exposure
- Long-term hold, not for trading
- Capital preservation priority
- Earning yield during consolidation
- Asymmetric upside if recovery accelerates
- Limited downside risk
Red Flags to Exit Positions
- Technical Breakdown:
- Bitcoin breaks below $58,000 with volume
- New all-time high in open interest (re-leveraging at lows)
- Macro Deterioration:
- Fed signals hawkish surprise (no rate cuts in 2026)
- CPI/PCE re-accelerates above 3%
- U.S. recession confirmed
- Crypto-Specific Catalysts:
- Major exchange insolvency or hack
- Regulatory crackdown (U.S. bans crypto)
- Bitcoin protocol vulnerability discovered
- On-Chain Red Flags:
- Miners capitulating (hash rate drops 20%+)
- Long-term holders distributing aggressively
- Stablecoin supply declining (capital leaving ecosystem)
Portfolio Allocation by Risk Profile
- Bitcoin: 40%
- Ethereum: 25%
- Solana/High-Beta L1s: 20%
- DeFi/Gaming Tokens: 10%
- Stablecoins: 5%
- Bitcoin: 50%
- Ethereum: 25%
- Stablecoins: 15%
- Solana/Alt L1s: 10%
- Bitcoin: 60%
- Ethereum: 15%
- Stablecoins: 20%
- Cash/Options: 5%
CONCLUSION: NAVIGATING THE STORM
What We Learned
- Leverage Kills: The 45% reduction in open interest from peak levels demonstrates that excessive leverage creates vulnerability. Healthy markets require organic demand, not leverage-fueled speculation.
- Bitcoin’s Relative Strength: While down 19%, Bitcoin significantly outperformed altcoins (down 30-35%), validating its status as “digital gold” and the asset institutional investors flee to during stress.
- Stablecoins Are Infrastructure: The continued growth of stablecoin market cap during the selloff (+$2B) proves that payment rails and DeFi infrastructure have achieved product-market fit independent of speculative trading.
- Institutions Are Patient: Corporate treasuries and long-term holders did not panic sell. The 17.9% of BTC held by institutions remained stable, signaling conviction in the long-term thesis.
- Statistical Extremes Revert: Bitcoin trading -2.88σ from its 200-day moving average—a level never before observed—creates powerful mean reversion potential.
The Path Forward
Expect continued volatility as the market digests deleveraging and waits for macro catalysts. The $66,000-$78,000 range likely holds for 4-8 weeks.
Regulatory clarity (CLARITY Act, stablecoin bill) and Fed rate cuts should provide fundamental support for recovery toward $85,000-$95,000.
Institutional adoption continues accelerating, tokenization market doubles, stablecoins reach $500B+ market cap. Bitcoin targets $100,000+ with potential for new all-time highs in 2027.
Final Thoughts
- 151 public companies holding $95B in Bitcoin
- $312B stablecoin market cap growing monthly
- Major enterprises (Stripe, PayPal, JPMorgan) building on blockchain
- Regulatory frameworks advancing globally
- Real world use cases (payments, prediction markets, tokenization) achieving product market fit
💬 Frequently Asked Questions (FAQ)
Did Bitcoin go up or down this week (Feb 9–16, 2026)?
Down ~2.1% from 70,127.9 to 68,629.6.
Did Ethereum outperform Bitcoin?
No. ETH fell ~6.2% over the same window.
What was the key BTC support level?
The week’s low was ~65,138 (Feb 12 low), a logical support reference.
What happened with spot Bitcoin ETF flows?
Flows swung from inflows early week to heavy outflows Feb 11–12, then small inflow Feb 13.
Why did sentiment feel risk off?
Headlines about liquidity/operational issues plus cross asset rotation into gold contributed to caution.
 Stay Connected:
 Related Analysis:
How High-Frequency Trading (HFT) (Impacts Crypto Arbitrage)
- Reinforcement Learning in Dynamic Markets (AI trading strategies)
- Crypto Arbitrage 101 (beginner’s guide to arbitrage)
Data Sources:
- CoinGecko – Real-time price data and market cap
- Yahoo Finance – Historical price data
- CoinDesk – Liquidation data
- Reuters – Market analysis
- Binance – Upcoming catalysts
Disclaimer: This analysis is for educational purposes. Arbitrage trading involves substantial risk, including custody risk, regulatory risk, and execution risk. Past performance is not indicative of future results. Never risk capital you cannot afford to lose. Consult qualified financial and legal advisors before trading.