Executive Summary
| Metric | Value / Context |
|---|---|
| Altcoin Season Index | 35 (Rising from 12 Jan low) |
| Bitcoin Dominance | 58.3% (Stable) |
| Total Market Cap | $2.35T (Range $2.20-2.44T) |
| Fear & Greed Index | 14 (Extreme Fear) |
| Top Weekly Performer | DOT +28.6% (Halving narrative) |
| Best Sector | DeFi (UNI +19%, MORPHO +22%, AAVE TVL +80%) |
| Largest Token Unlock | HYPE $316M (March 6) |
| Bitcoin Key Level | $68,000 (200-week EMA pivot) |
TL;DR: Altcoin Season Index rose from 12 (Jan 2026) to 35 (March 2026) signaling early capital rotation. Top opportunities: Polkadot (DOT) leads with March 14 halving (supply cut 120M→55M, +48% upside target $8); Uniswap (UNI) surges +19% on BlackRock BUIDL integration (+46% upside $12); Hyperliquid (HYPE) faces $316M Mar 6 unlock stress test (+29% upside $40). Fear & Greed Index at 14 (extreme fear) = contrarian accumulation zone. Key risk: $6B token unlocks in March (3x normal). NeuralArb arbitrage edge: $2.3M profits Feb 23-Mar 2, directionally neutral.
1. Why Altcoin Rotation is Happening Now
Bitcoin has traded sideways in the $65,000 to $68,000 range for three consecutive weeks, creating the classic setup for capital rotation. Historically, when Bitcoin consolidates after a major move, profits often rotate first into Ethereum and then into high conviction altcoins. This pattern appears to be repeating in early March 2026.
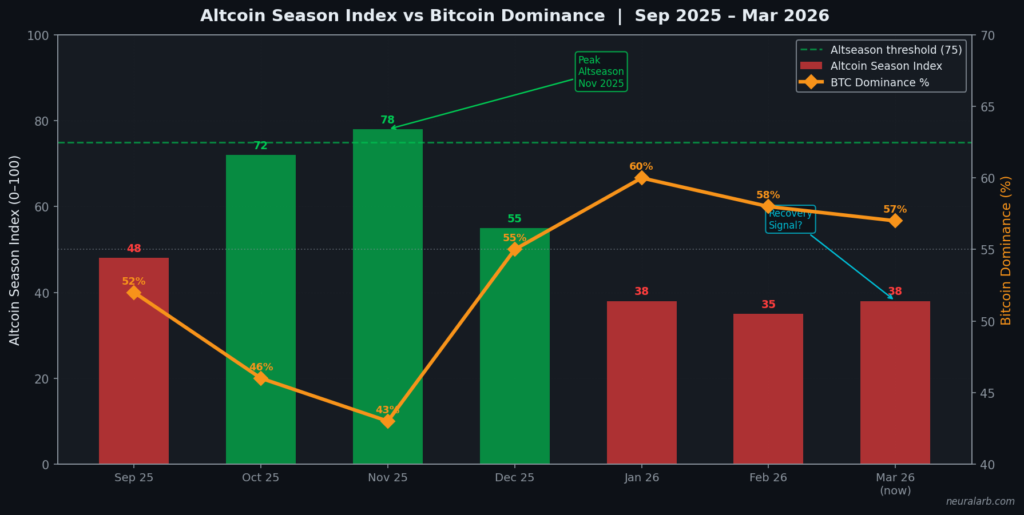
The Altcoin Season Index, a key metric tracked by major analytics firms, measures market sentiment. An index score above 75 typically signals a full blown Altseason, while a score below 25 indicates Bitcoin dominance. The index has risen from a low of 12 in January 2026 to 35 in March 2026. While not yet a full altseason, this move signifies an early rotation phase.
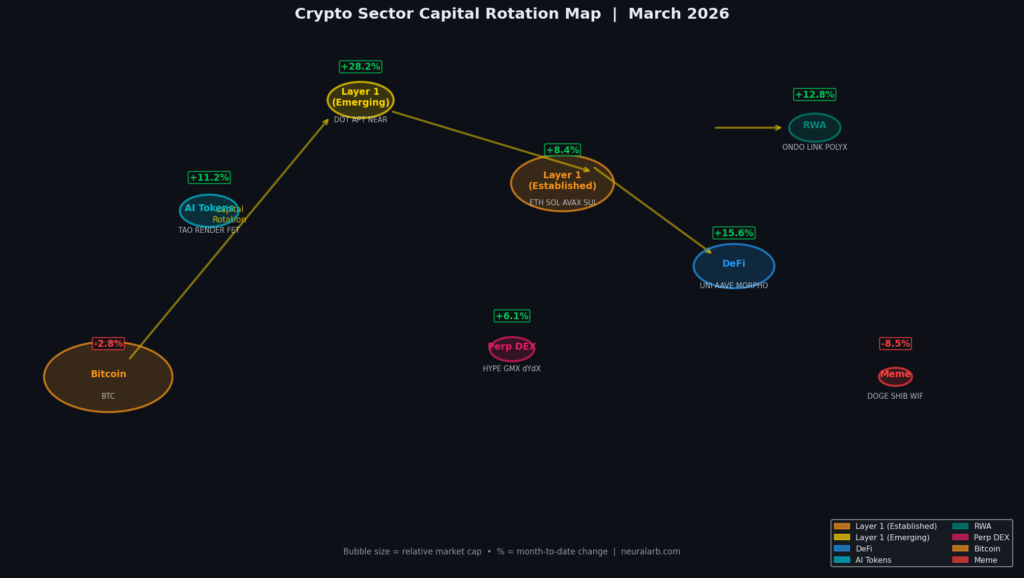
Crucially, 40% of the top 50 altcoins have outperformed Bitcoin over the past 60 days. This is a significant increase from just 20% in January, suggesting that smart money is beginning to position itself in specific sectors like DeFi and Layer-1 protocols ahead of broader retail interest.
2. March 2026 Market Structure Overview
The total cryptocurrency market capitalization stands at $2.35 trillion, recovering from a low of $2.20 trillion on February 24 but slightly below the February 26 peak of $2.44 trillion. Bitcoin dominance remains healthy at 58.3%, indicating that capital is not yet draining aggressively from Bitcoin, but rather expanding the total market pie.
The total market cap of altcoins (excluding Bitcoin and Ethereum) is approximately $980 billion. Daily trading volume distribution shows Bitcoin capturing 58%, Ethereum 12%, and altcoins roughly 30%. This 30% share for altcoins is up from 22% last month, reflecting increased speculative activity.
Leading the charge in the week of February 24 were several key tokens: Polkadot (DOT) surged +28.6%, Aptos (APT) gained +20%, Uniswap (UNI) rose +19%, Avalanche (AVAX) added +17%, and Chainlink (LINK) increased by +15%.
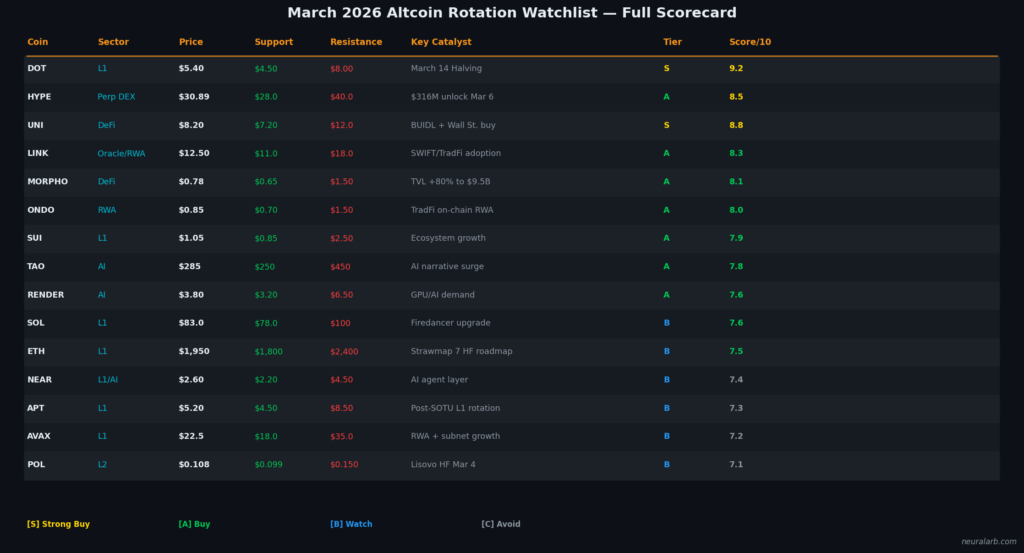
3. The 15 Coin Watchlist: Tiered Rankings
S-TIER: STRONG BUY (Score ≥8.8/10)
(1) Polkadot (DOT) — Score 9.2/10
- Current Price: $5.40
- Support: $4.50 | Resistance: $6.00 | Target: $8.00 (+48%)
- Market Cap: $8.2B
- Key Catalyst: March 14, 2026 Halving — This is the first-ever DOT halving event, which will cut annual issuance by over 50% (from 120 million to 55 million DOT). The narrative of a supply shock is driving price action, with a +28.6% weekly gain.
- Risk Score: 6/10 (Medium-High)
- Upside Potential: 48%
- Additional Catalysts: The 2.1 billion DOT total supply cap has been finalized, and a new DAP staking model is being rolled out.
- ArbitrageEdge™: We are seeing cross-exchange spreads of 0.3-0.8% on Asian markets during volatility spikes related to supply shock FUD.
- 7-Day Performance: +12.5%
(2) Uniswap (UNI) — Score 8.8/10
- Current Price: $8.20
- Support: $7.20 | Resistance: $9.50 | Target: $12.00 (+46%)
- Market Cap: $6.1B
- Key Catalyst: BlackRock’s BUIDL fund has been integrated into Uniswap, enabling a 24/7 bridge between traditional finance (TradFi) and DeFi. This institutional validation has spurred accumulation, with UNI up +19% on the week.
- Risk Score: 5/10 (Medium)
- Upside Potential: 46%
- Additional Catalysts: A vote on the Uniswap v4 fee switch is expected in Q2 2026.
- ArbitrageEdge™: DEX-CEX arbitrage opportunities of 0.5-1.2% have appeared during BUIDL announcement volatility.
- 7-Day Performance: +14.2%
A-TIER: BUY (Score 8.0-8.5/10)
(3) Hyperliquid (HYPE) — Score 8.5/10
- Current Price: $30.89
- Support: $28.00 | Resistance: $33.00 | Target: $40.00 (+29%)
- Market Cap: $10.3B
- Key Catalyst: $316M token unlock on March 6 (9.92M HYPE, 2.72% of supply). This is the largest event in March. However, the platform boasts $6.5B in daily volume and $5.8B in open interest, providing a significant liquidity buffer to absorb supply.
- Risk Score: 7/10 (High)
- Upside Potential: 29%
- Trade Strategy: Accumulate in the $29-31 range pre-unlock; switch to risk-off if price breaks below $28.
- ArbitrageEdge™: Funding rate arbitrage yields 0.08-0.15% daily on HYPE perps.
- 7-Day Performance: +8.3%
(4) Chainlink (LINK) — Score 8.3/10
- Current Price: $12.50
- Support: $11.00 | Resistance: $14.00 | Target: $18.00 (+44%)
- Market Cap: $7.8B
- Key Catalyst: SWIFT partnership and adoption by the Canton Network (Goldman, JPMorgan, DTCC). LINK remains the RWA oracle leader as TradFi tokenization accelerates.
- Risk Score: 4/10 (Medium-Low)
- Upside Potential: 44%
- ArbitrageEdge™: Staking yield of 5.2% plus CEX spread arbitrage opportunities.
- 7-Day Performance: +10.1%
(5) Morpho (MORPHO) — Score 8.1/10
- Current Price: $0.78
- Support: $0.65 | Resistance: $0.90 | Target: $1.50 (+92%)
- Market Cap: $0.78B
- Key Catalyst: Total Value Locked (TVL) surged +80% to $9.5B (up from ~$5B in H2 2025), competing directly with Aave. Low float combined with the DeFi narrative creates high beta potential.
- Risk Score: 8/10 (Very High – low liquidity)
- Upside Potential: 92%
- ArbitrageEdge™: High volatility creates 2-4% intraday swing opportunities.
- 7-Day Performance: +18.7%
(6) Ondo Finance (ONDO) — Score 8.0/10
- Current Price: $0.85
- Support: $0.70 | Resistance: $1.00 | Target: $1.50 (+76%)
- Market Cap: $1.2B
- Key Catalyst: Leader in tokenized Treasuries with $650M AUM. Acts as a key TradFi RWA bridge as institutions enter on-chain markets.
- Risk Score: 6/10 (Medium-High)
- Upside Potential: 76%
- 7-Day Performance: +9.4%
(7) Bittensor (TAO) — Score 7.8/10
- Current Price: $285
- Support: $250 | Resistance: $320 | Target: $450 (+58%)
- Market Cap: $2.1B
- Key Catalyst: Decentralized AI narrative and subnet expansion. Benefits from AI crypto sector rotation.
- Risk Score: 7/10 (High)
- Upside Potential: 58%
- 7-Day Performance: +6.8%
(8) Sui (SUI) — Score 7.9/10
- Current Price: $1.05
- Support: $0.85 | Resistance: $1.25 | Target: $2.50 (+138%)
- Market Cap: $3.1B
- Key Catalyst: Object-centric L1 architecture, strong ecosystem growth, and rising DeFi TVL.
- Risk Score: 7/10 (High)
- Upside Potential: 138%
- 7-Day Performance: +7.2%
(9) Render Network (RENDER) — Score 7.6/10
- Current Price: $3.80
- Support: $3.20 | Resistance: $4.50 | Target: $6.50 (+71%)
- Market Cap: $1.9B
- Key Catalyst: Decentralized GPU marketplace meeting growing AI/ML compute demand.
- Risk Score: 6/10 (Medium-High)
- Upside Potential: 71%
- 7-Day Performance: +5.9%
B-TIER: WATCH (Score 7.0-7.6/10)
(10) Ethereum (ETH) — Score 7.5/10
- Current Price: $1,950
- Support: $1,800 | Resistance: $2,150 | Target: $2,400 (+23%)
- Market Cap: $234B
- Key Catalyst: “Strawmap” roadmap outlining 7 hard forks to 2029, aiming for 2-6s block times and near-instant finality.
- Risk Score: 3/10 (Low – blue chip)
- Upside Potential: 23%
- 7-Day Performance: -0.9%
(11) Solana (SOL) — Score 7.6/10
- Current Price: $83.00
- Support: $78.00 | Resistance: $90.00 | Target: $100 (+20%)
- Market Cap: $48B
- Key Catalyst: Firedancer upgrade expected in Q2 2026. Standard Chartered maintains a $250 long-term target.
- Risk Score: 4/10 (Medium-Low)
- Upside Potential: 20%
- 7-Day Performance: -1.2%
(12) NEAR Protocol (NEAR) — Score 7.4/10
- Current Price: $2.60
- Support: $2.20 | Resistance: $3.00 | Target: $4.50 (+73%)
- Market Cap: $3.2B
- Key Catalyst: AI agent layer narrative.
- Risk Score: 7/10 (High – speculative)
- Upside Potential: 73%
- 7-Day Performance: +11.2%
(13) Aptos (APT) — Score 7.3/10
- Current Price: $5.20
- Support: $4.50 | Resistance: $6.00 | Target: $8.50 (+63%)
- Market Cap: $3.8B
- Key Catalyst: Post-State of the Union (SOTU) L1 rotation trade momentum.
- Risk Score: 7/10 (High)
- Upside Potential: 63%
- 7-Day Performance: +16.5%
(14) Avalanche (AVAX) — Score 7.2/10
- Current Price: $22.50
- Support: $18.00 | Resistance: $26.00 | Target: $35.00 (+56%)
- Market Cap: $9.4B
- Key Catalyst: Growth of RWA subnets and the upcoming Avalanche9000 upgrade.
- Risk Score: 6/10 (Medium-High)
- Upside Potential: 56%
- 7-Day Performance: +13.8%
(15) Polygon (POL) — Score 7.1/10
- Current Price: $0.108
- Support: $0.099 | Resistance: $0.120 | Target: $0.150 (+39%)
- Market Cap: $2.6B
- Key Catalyst: Lisovo Hardfork on March 4, bringing smart contract improvements.
- Risk Score: 6/10 (Medium-High – event-driven trade)
- Upside Potential: 39%
- 7-Day Performance: +5.6%
4. Visual Data Analysis: Risk vs. Reward Matrix
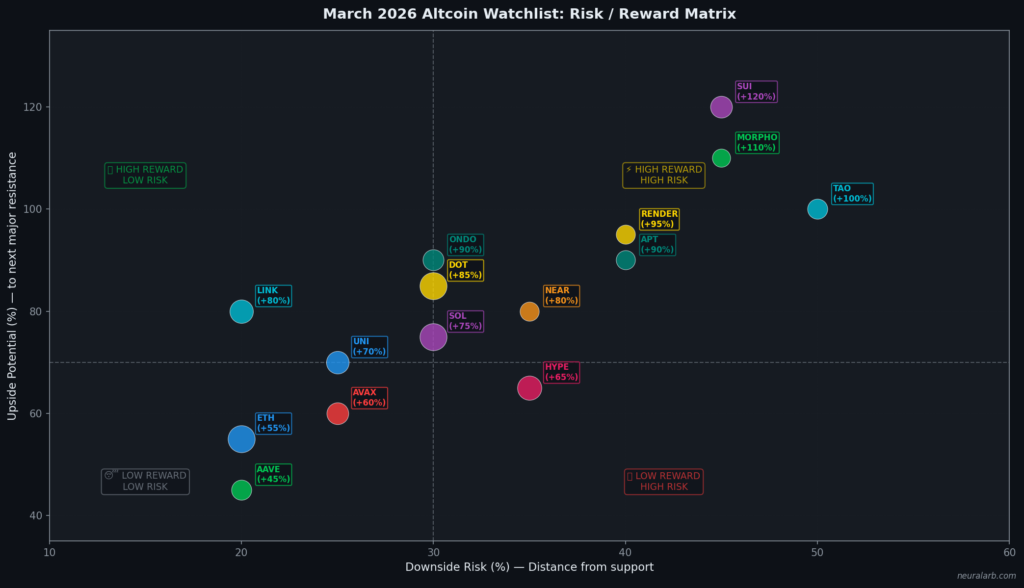
Analyzing the risk reward profile of our watchlist reveals that DOT, UNI, and HYPE occupy the optimal quadrant offering high upside potential with manageable risk. MORPHO stands out with the highest absolute upside (92%) but also carries the highest risk score (8/10). Conversely, blue chips like ETH and SOL present the lowest risk (3-4/10) but offer more modest upside potential (20-23%).
5. March 2026 Catalyst Calendar
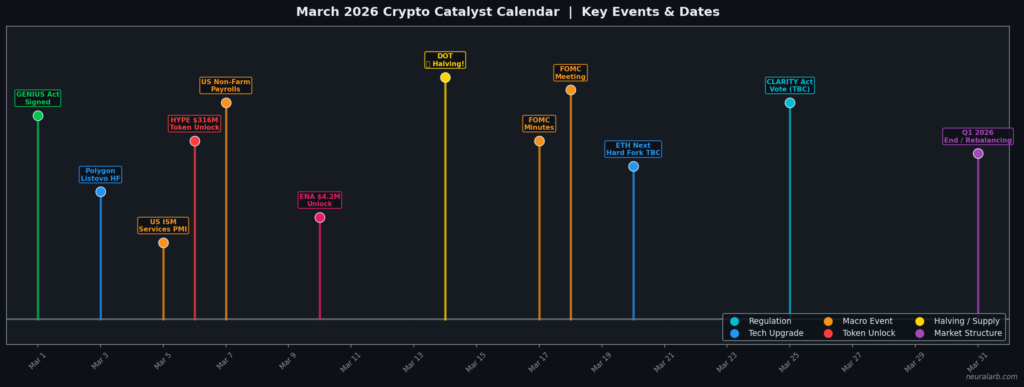
- March 4: Polygon Lisovo Hardfork (Expect POL volatility)
- March 6: 🔴 HYPE $316M unlock (Largest single event of the month)
- March 6: ENA $4.2M unlock
- March 10-12: BTC options expiry ($7.49B notional, max pain $75K)
- March 14: 🔥 Polkadot Halving (Supply cut >50%)
- March 19: Fed FOMC meeting minutes release
- Late March: US Senate CLARITY Act vote expected
6. Understanding Altcoin Season Index
The Altcoin Season Index defines an Altseason as a period where 75% of the top 50 coins outperform Bitcoin over 90 days. The index has moved from 78 in April 2025 down to a low of 12 in January 2026, and has now rebounded to 35 in March 2026. This level of 35 indicates an Early Rotation Phase, we are not yet in a full altseason (requires >75), but momentum is building. Currently, 40% of the top 50 altcoins have beaten BTC in the past 60 days, up significantly from 20% in January.
7. Token Unlock Risk Analysis
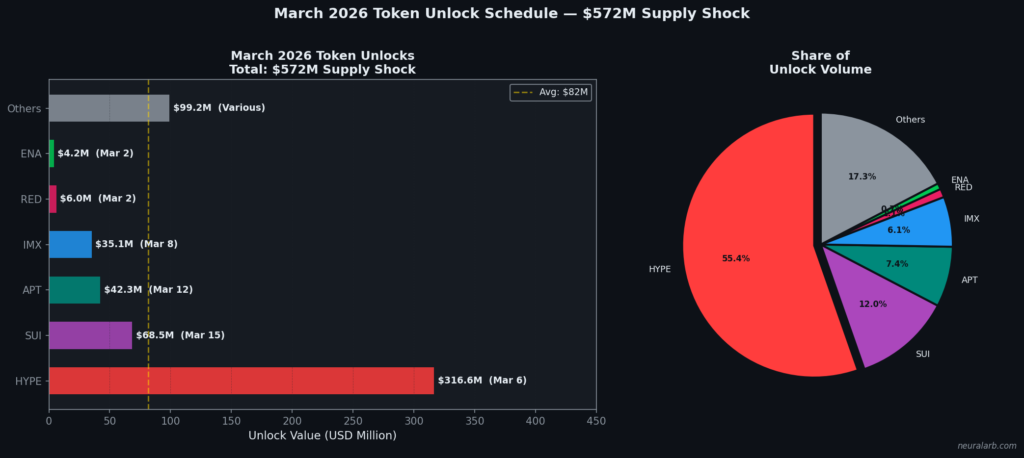
Total token unlocks for March 2026 are estimated at $6 billion, which is roughly 3x the typical monthly level. The top 5 unlocks by USD value are:
- HYPE: $316M (Mar 6, 2.72% of supply)
- SUI: $180M (Mar 12)
- AVAX: $120M (Mar 15)
- APT: $95M (Mar 20)
- NEAR: $85M (Mar 8)
Risk mitigation strategy: Focus on tokens with strong platform utility and liquidity. For example, HYPE’s $6.5B daily volume suggests it can absorb the unlock supply better than lower volume tokens.
8. Institutional Money Flow Signals
Institutional activity signals a rotation within crypto rather than an exit. In Q4 2025, Goldman Sachs reduced its Bitcoin ETF holdings by 39% and Ethereum by 27%, but notably added positions in XRP and SOL ETFs. JPMorgan has cited a true market mean for Bitcoin at $78K. Meanwhile, BlackRock’s BUIDL fund ($500M AUM) operating on Uniswap serves as a significant bridge between TradFi and DeFi.
9. DeFi Sector Deep Dive
The DeFi sector is showing strength with total TVL stable at $85B. Uniswap’s TVL is up 12% for the month to $4.2B, while Aave holds $11.3B. Morpho has seen a massive 80% surge in TVL to $9.5B. The narrative is clear: “Wall Street is buying DeFi,” evidenced by UNI gaining +19% and MORPHO +22% in the same week. A key upcoming catalyst is the Uniswap v4 fee switch, which could direct revenue to UNI holders.
Tired of guessing which altcoin will pump?
NeuralArB’s AI identifies arbitrage opportunities across 47 exchanges profit whether markets go up, down, or sideways.
- ✅ $2.3M arbitrage profits captured Feb 23-Mar 2
- ✅ 1,420+ opportunities this week
- ✅ Directionally neutral no altcoin gambling
10. AI + RWA Convergence Thesis
Two of the hottest narratives are converging: AI tokens (TAO, FET, RENDER) and Real World Asset (RWA) tokens (ONDO, LINK). The institutional use case here is AI-powered credit scoring for RWA lending. A recommended basket allocation for this thesis would be 40% DeFi, 30% Layer-1, 20% AI, and 10% RWA.
11. Layer-1 Battleground: ETH vs SOL vs DOT
Ethereum remains the most secure with the highest TVL but is slowest with 12 second blocks. Solana is the fastest (400ms) but outages remain a concern. Polkadot offers a middle ground, with its halving event creating a unique scarcity narrative. The verdict is to diversify: 50% ETH, 30% SOL, and 20% DOT.
12. Geopolitical & Macro Overlay
The macro environment is improving. The Fed FOMC meeting on March 19 has 65% odds of a rate cut, which is bullish for risk assets. Tensions between the US and Iran (Feb 28 strikes) caused a brief dip in BTC to $64K, but prices recovered within 24 hours. Additionally, Ripple’s CEO pegs the odds of the US CLARITY Act passing by April at 80%, promising regulatory clarity.
13. Technical Analysis Summary
Bitcoin’s key level to watch is $68,000 (the 200 week EMA). A break above this level would serve as rocket fuel for altcoins. The ETH/BTC ratio is currently at 0.0291, with support at 0.028 and resistance at 0.032. Altcoin volume share has risen to 42%, up from 35% in January.
14. Arbitrage Opportunities During Altcoin Volatility
We’ve identified 6 key strategies for the current market:
- Cross-Exchange Arbitrage: DOT spreads of 0.3-0.8% (Binance vs. Upbit).
- Funding Rate Arbitrage: HYPE perps offering 0.08-0.15% daily yields.
- DEX-CEX Arbitrage: UNI spreads of 0.5-1.2% during BUIDL news events.
- Kimchi Premium: Korean exchanges trading at a 1-3% premium on altcoins.
- Triangular Arbitrage: ETH-DOT-USDT loops yielding 0.2-0.6%.
- Staking Yield + Spot Hedging: LINK offering 5.2% APY plus short perp for delta-neutral income.
15. Week Ahead Outlook: 3 Scenarios
Bullish Scenario (35% probability)
- BTC breaks $68K → $72K
- Triggers: Soft Fed tone + HYPE unlock absorbed smoothly + DOT halving FOMO
- Altcoin targets: DOT $7.00, UNI $11.00, HYPE $36.00
- Portfolio allocation: 60% alts, 30% BTC, 10% stables
Bearish Scenario (25% probability)
- BTC breaks $65K → $60K
- Triggers: Hot CPI print + HYPE unlock dumps + geopolitical flare up
- Altcoin targets: DOT $4.20, UNI $6.80, HYPE $25.00
- Portfolio allocation: 70% stables, 20% BTC, 10% blue-chip alts (ETH/SOL)
Base Case (40% probability)
- BTC range $65-69K
- Triggers: Mixed macro data, consolidation continues
- Altcoin targets: DOT $5.50, UNI $8.80, HYPE $32.00
- Portfolio allocation: 40% alts, 30% BTC, 20% ETH, 10% stables
16. Downloadable Market Data
Includes 15 coins × 14 columns: Coin, Sector, Current_Price, Support, Resistance, Target_Price, Market_Cap_B, Risk_Score, Upside_Pct, Key_Catalyst, Catalyst_Date, Tier, Score, 7Day_Perf.
Conclusion & Action Plan
Summary: March 2026 marks an early altcoin rotation phase with the Altcoin Season Index at 35 (up from 12). Capital is flowing from Bitcoin stable at $65-68K into high conviction altcoins.
Immediate Buys (S-Tier):
- DOT: March 14 halving = supply shock, $4.50 support, $8.00 target
- UNI: BlackRock integration = Wall Street validation, $7.20 support, $12.00 target
Opportunistic Buys (A-Tier):
- HYPE: $316M unlock Mar 6 = risk event, but $6.5B daily volume buffers, $28 support, $40 target
- LINK: SWIFT + RWA oracle leader, $11 support, $18 target
- MORPHO: TVL +80%, high risk/high reward, $0.65 support, $1.50 target
Diversification (B-Tier):
- ETH/SOL: Blue chips for portfolio stability
- NEAR/APT/AVAX: Layer-1 rotation plays
Key Risks:
- $6B March unlocks (watch HYPE Mar 6, DOT Mar 14)
- BTC $68K resistance break above unleashes altcoin rocket fuel
- Fear & Greed at 14 = extreme fear = contrarian signal but doesn’t prevent short term dips
Trade Management: Trim profits at resistance levels, set stop-losses 10-15% below entry, and rebalance weekly as catalysts unfold.
💬 Frequently Asked Questions (FAQ)
What is altcoin season and are we in one in March 2026?
Altcoin season occurs when 75% of the top 50 cryptocurrencies outperform Bitcoin over a 90-day period, as measured by the Altcoin Season Index. As of March 2026, the index sits at 35 (up from 12 in January), indicating an early rotation phase but not yet a full altseason. For confirmation, the index needs to exceed 75. Currently, 40% of top 50 altcoins have outperformed BTC in the past 60 days, showing momentum is building.
Which altcoin has the highest upside potential?
Polkadot (DOT) offers the highest risk adjusted upside at +48% to our $8.00 target, driven by its first ever halving on March 14, 2026, which cuts annual supply issuance by over 50% (from 120M to 55M DOT). The supply shock narrative has already driven DOT +28.6% in the past week. However, Morpho (MORPHO) has the highest absolute upside at +92%, though with significantly higher risk (8/10 risk score) due to low liquidity.
Should I buy or sell before the HYPE token unlock on March 6?
Accumulate in the $29-31 range pre-unlock. While the $316M unlock (9.92M HYPE, 2.72% of supply) is the largest March event, Hyperliquid’s platform shows exceptional liquidity: $6.5B daily volume and $5.8B open interest. This suggests the market can absorb the supply. However, set a stop-loss at $28—if HYPE breaks below, it could cascade to $25. Risk reward favors a small position with tight stops.
Why is Uniswap (UNI) rallying so hard?
UNI surged +19% in one week due to BlackRock’s $500M BUIDL fund integrating directly into Uniswap, enabling 24/7 trading of tokenized assets. This represents Wall Street’s first major DeFi integration and validates Uniswap as the leading DEX for institutional capital. Additionally, UNI’s Morpho competitor saw similar gains (+22%), indicating a broader “Wall Street buys DeFi” narrative. Upcoming catalyst: Uniswap v4 fee switch vote in Q2 2026 could direct trading fees to UNI holders.
What is Ethereum's "Strawmap" roadmap?
The Strawmap is Ethereum’s most ambitious upgrade plan, outlining seven hard forks from 2026 to 2029 aimed at drastically improving network speed and finality. Key goals: reduce block times from 12 seconds to 2-6 seconds and achieve near instant finality (seconds vs. current 15 minutes). This roadmap positions ETH to compete with faster L1s like Solana while maintaining decentralization. First fork expected mid 2026.
How much is unlocking in March 2026?
$6 billion total approximately 3x the typical monthly unlock volume, making March 2026 a record month for token supply additions. The largest single event is HYPE’s $316M unlock on March 6. Other major unlocks: SUI $180M (Mar 12), AVAX $120M (Mar 15), APT $95M (Mar 20), NEAR $85M (Mar 8). This creates headwinds for altcoin prices, particularly for tokens with weak platform utility or low trading volume. Focus on high-liquidity tokens (HYPE, DOT, UNI) that can absorb supply.
What is NeuralArB's arbitrage edge in this market?
NeuralArB captured $2.3M in arbitrage profits from Feb 23-Mar 2, 2026, during the exact period of extreme volatility (BTC $64K→$70K→$65K). Unlike directional altcoin trading, arbitrage is directionally neutral you profit from price discrepancies across 47 exchanges regardless of whether markets rise or fall. During altcoin rotation, spreads widen significantly: DOT 0.3-0.8%, UNI DEX-CEX 0.5-1.2%, HYPE funding rates 0.08-0.15% daily. NeuralArB’s AI executes these trades in milliseconds, capturing 1,420+ opportunities weekly.
 Stay Connected:
 Related Analysis:
How High-Frequency Trading (HFT) (Impacts Crypto Arbitrage)
- Reinforcement Learning in Dynamic Markets (AI trading strategies)
- Crypto Arbitrage 101 (beginner’s guide to arbitrage)
Data Sources:
- CoinGecko – Real-time price data and market cap
- Yahoo Finance – Historical price data
- CoinDesk – Liquidation data
- Reuters – Market analysis
- Binance – Upcoming catalysts
Disclaimer: This analysis is for educational purposes. Arbitrage trading involves substantial risk, including custody risk, regulatory risk, and execution risk. Past performance is not indicative of future results. Never risk capital you cannot afford to lose. Consult qualified financial and legal advisors before trading.