RWA Arbitrage Explained: Can Tokenized Treasuries and Funds Create New Price Gaps?

RWA Arbitrage Explained: Tokenized Treasury Price Gaps

The tokenized treasury market has exploded from under $200 million to over $12.78 billion in just three years. This isn’t just a story of adoption, it’s a story of market structure evolution. As of early 2026, the total Real-World Asset (RWA) sector grew 266% in a single year to surpass $24 billion in total value locked.


As major financial institutions wrap real-world yield bearing assets into on-chain tokens, a completely new class of arbitrage opportunity has emerged. These are not traditional crypto arbitrage gaps based on exchange inefficiencies. They are structural inefficiencies born from deep, systemic frictions:


    • Yield spreads between on-chain sterile assets (stablecoins) and off-chain yielding instruments.
    • Chain fragmentation where the same asset trades at different prices on Ethereum, Solana, and Base.
    • Liquidity asymmetry between institutional access tiers and retail permissionless markets.
    • Oracle lag creating known, exploitable mispricings during macro events.

The question for sophisticated traders is no longer if these gaps exist, but whether they can be consistently exploited. And in a market that never sleeps but relies on daily banking updates, how does AI fit into the execution equation?


1. What Is RWA Tokenization and Why Does It Matter for Arbitrage?


Real-World Assets (RWAs) are traditional financial instruments such as US Treasury bills, money market funds, corporate bonds, and real estate—that have been tokenized on a blockchain. The key distinction from synthetic assets is that tokenized RWAs are backed 1:1 by actual assets held in regulated custodial vaults.

How Tokenization Works

The issuer wraps the asset legally, a custodian holds the underlying securities (e.g., T-bills at BNY Mellon), a smart contract mints the corresponding token, and an oracle updates the Net Asset Value (NAV) typically once per daily cycle.

Major Products and Issuers


The landscape is dominated by a mix of traditional finance giants and crypto-native firms:


    • BlackRock BUIDL ($2.2B, Ethereum) — An institutional, permissioned fund.
    • Circle USYC ($2.66B, Ethereum) — A yield-bearing stablecoin structure.
    • Ondo USDY ($1.64B, Multi-chain) — A permissionless yield token structured as a secured note.
    • Franklin Templeton BENJI ($1.02B, Stellar+Ethereum) — One of the first regulated on-chain funds.
    • WisdomTree WTGXX ($832M) — Integrating traditional asset management with blockchain rails.
    • Ondo OUSG ($621M) — An institutional wrapper for BlackRock’s iShares ETFs.

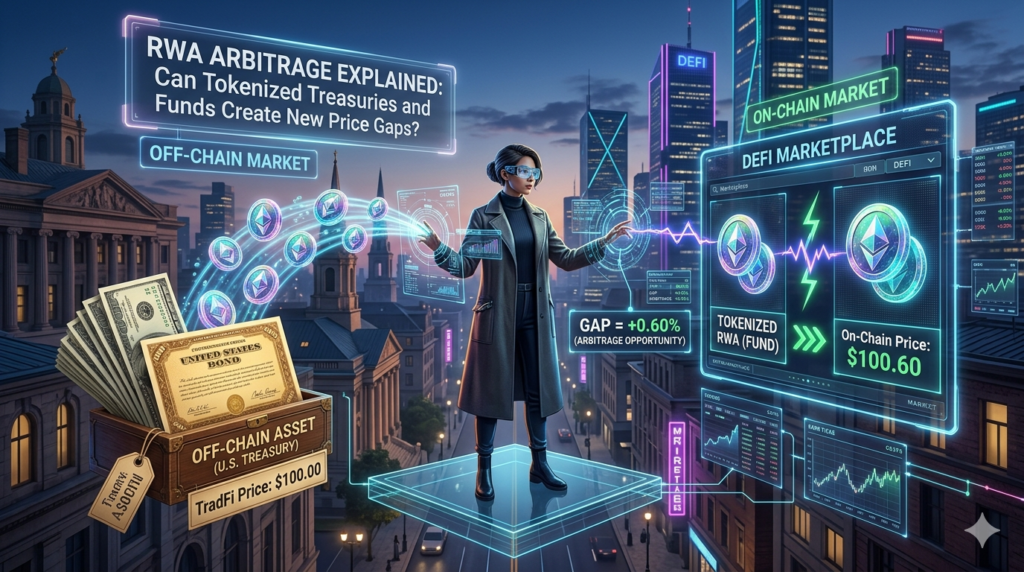
Why this creates arbitrage: Unlike stablecoins (USDT/USDC) which are designed to always equal $1.00, tokenized treasuries have a variable NAV that reflects accrued interest. However, because the underlying asset markets (TradFi) close on weekends and holidays, and oracles often update only once per day, the token price does not always perfectly reflect instantaneous market conditions. This disconnect creates intraday gaps between the token’s trading price and its actual, realizable NAV.
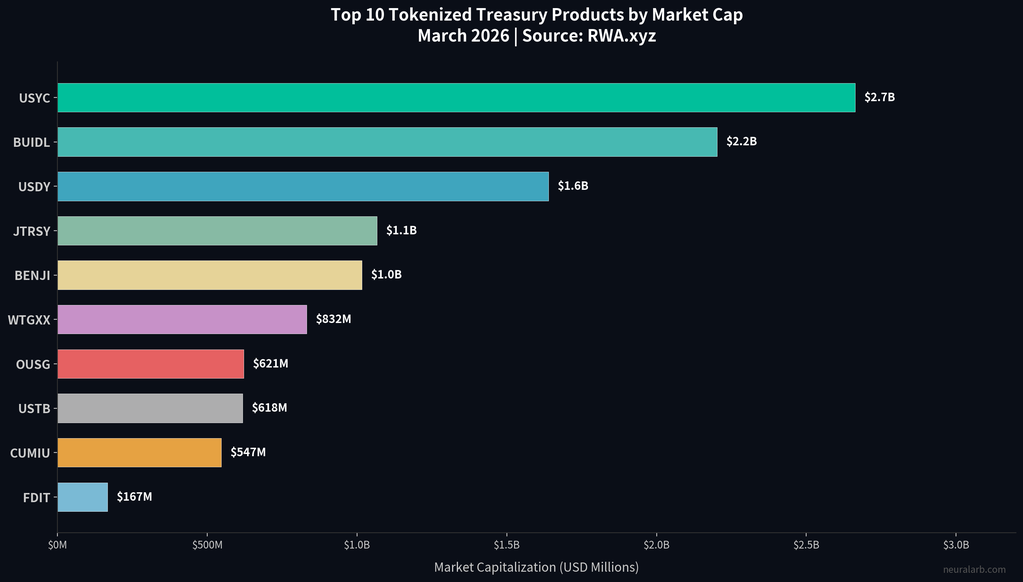
Top 10 Tokenized Treasury Products by Market Cap
Top 10 Tokenized Treasury Products by Market Cap (March 2026)


2. The Market Size That Justifies a Strategy


Arbitrage strategies require liquidity to be scalable. In the past, RWA markets were too small to support serious capital deployment. That has changed dramatically.


According to data from RWA.xyz, the total market capitalization of tokenized treasuries stands at $12.78 billion as of March 2026. The broader RWA market, excluding stablecoins, exceeds $24 billion, driven by a staggering 266% growth rate in 2025 alone.

⚡ Growth Milestones

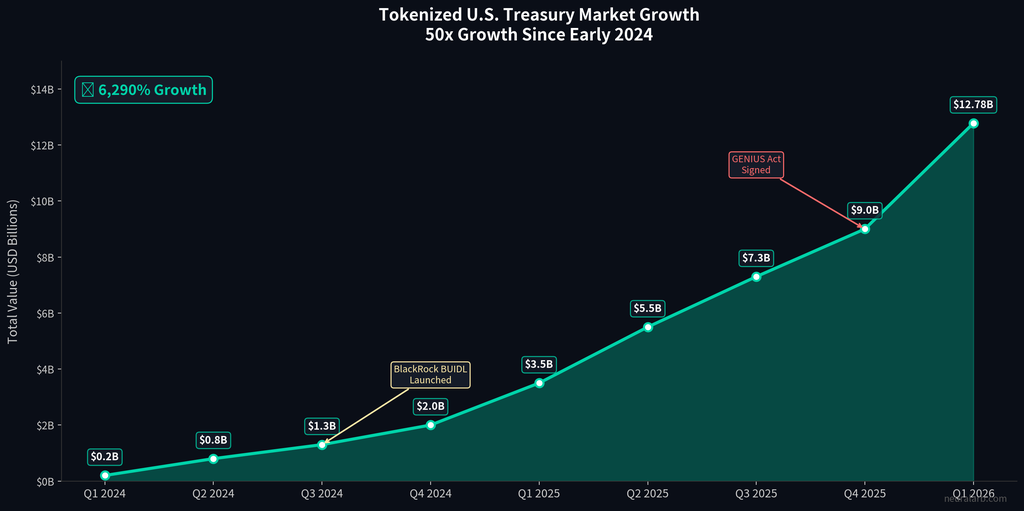
Tokenized US Treasuries have grown 50x from early 2024 to 2026. The sector started the year at $8.9 billion on Jan 1, 2026, and surged to over $10.8 billion by late January before hitting current highs. Projections place the market at over $14 billion by the end of 2026.

Furthermore, yields in private credit RWAs are tracking between 8–12%, compared to the risk-free rate of 3–5% for treasury tokens. This scale matters because larger markets mean more venues, deeper liquidity pools, and the ability to deploy significant capital without slippage eating the entire arbitrage edge.


PeriodMarket CapGrowth Driver
Early 2024~$200MEarly pilots (Franklin Templeton BENJI, Ondo OUSG)
Mid 2024~$1.3BBlackRock BUIDL launch; institutional FOMO begins
Early 2025~$4BFed rate hold keeps T-bill yields attractive
Jan 1, 2026$8.9BDeFi collateral adoption; BUIDL on Deribit/Binance
Late Jan 2026$10.8B+Circle USYC surges; Ondo tokenizes Franklin ETFs
March 2026$12.78BInstitutional mainstream; multi-chain expansion
Tokenized Treasury Market Growth Timeline (50x Growth)
Tokenized Treasury Market Growth Timeline 2022–2026 - From $200M to $12.78B+


3. Where the Price Gaps Actually Come From


These arbitrage opportunities are not random market noise. They are structural. Here are the five distinct mechanisms creating price gaps in the RWA market:


3.1 Yield Arbitrage: The “On-Chain Sterility” Gap


US T-bill yields have hovered between 4-5% through 2024-2025. Meanwhile, standard stablecoins like USDT and USDC offer 0% native yield to holders. Tokenized T-bills, by contrast, offer 3.0-5.1%.


This creates massive hydraulic pressure to move capital from sterile stablecoins into tokenized yield. During periods of high demand, this rotation creates temporary surges where token prices trade slightly above their NAV. Arbitrageurs can buy USDT (trading at par), mint or swap into the yielding token, and capture the premium.


3.2 Chain Fragmentation Gaps


The same asset often trades on different chains at different prices. Ondo’s USDY, for example, is available on Ethereum, Solana, Aptos, and Sui. However, the oracle updates and DEX liquidity pools on these chains operate independently.


Real example: During a rate-change news event, Solana DEX updates lagged Ethereum price discovery by roughly 15 minutes. For that window, USDY on Solana traded at a 0.3% premium compared to Ethereum. Automated bots bridged capital to sell into the Solana premium and buy back on Ethereum.

3.3 Oracle Lag and NAV Update Gaps


Most tokenized treasury NAVs update daily. However, intraday interest rate news, such as FOMC decisions or Treasury auction results changes the implied value of the underlying assets instantly. This creates a 2-4 hour window of known mispricing.


If the Fed signals a rate cut at 2:00 PM ET, the value of the underlying bond portfolio increases immediately. But the on-chain NAV update might not happen until 5:00 PM or the next morning. Traders who predict this update can front run the oracle by buying the token at the stale price.


3.4 Liquidity Tier Gaps: Institutional vs. Retail Access


BlackRock’s BUIDL has a $5 million minimum investment and restricts access to accredited investors. Retail equivalents like USDY have no minimums. This creates a two tier market.


The spread between BUIDL’s yield (3.45%) and retail-accessible USDY (3.55%) reflects an institutional access premium. Protocols that “wrap” BUIDL for retail DeFi use effectively capture this spread by bridging the liquidity gap.


3.5 DeFi Composability Premiums


When tokenized treasuries are accepted as collateral on major exchanges like Deribit or Binance, traders are willing to pay a premium for them. Why? Because posting BUIDL as margin earns you yield, whereas posting USDC does not.


This collateral efficiency premium can push token prices 0.1-0.5% above NAV during bull markets when leverage demand is high. Timing entry and exit around these collateral demand cycles is a consistent edge.
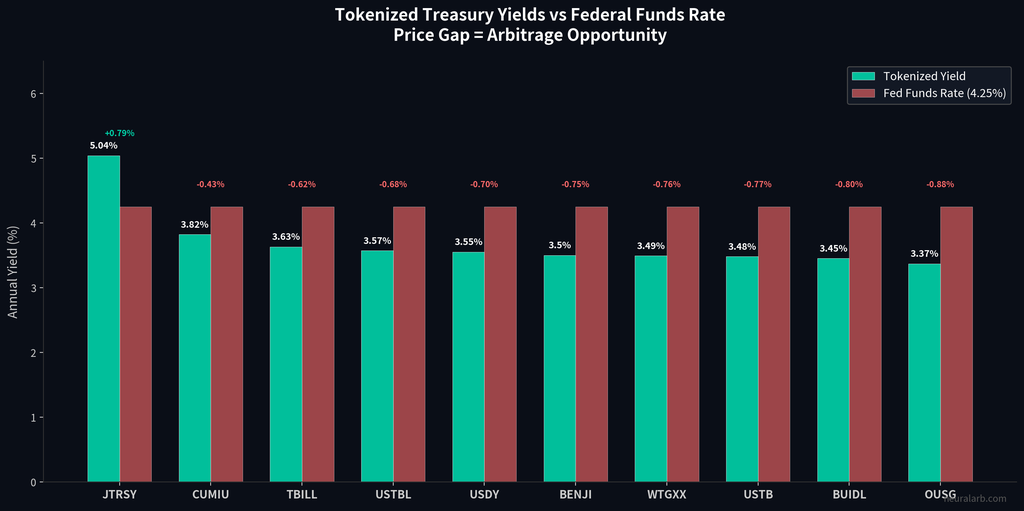
Tokenized Treasury Yields vs Federal Funds Rate
Yield Comparison: Tokenized Treasury Products vs. Traditional Cash (March 2026)


4. The 5 RWA Arbitrage Strategies in Depth


Below are the five primary strategies deployed by sophisticated desks and AI systems:


StrategyMechanismCapital Req.RiskEst. Edge
NAV CaptureBuy/Sell vs. Daily NAV rebase$50K – $500KLow-Med0.2% – 0.8%
Cross-Chain ArbExploit price/yield diffs across chains$100K – $1MBridge Risk0.3% – 1.0% / mo
Stablecoin RotationYield farming vs. lending rates$25K+Low1% – 3% APY boost
Oracle Front-RunTrade ahead of NAV updates on macro news$50K+Execution0.2% – 0.5% / event
Collateral ArbEarn yield on margin + funding rates$100K+Market Exp.2% – 4% APY boost


Strategy 1: NAV Discount/Premium Capture

Monitor secondary market prices against the officially announced NAV. When a token trades >0.3% above NAV, sell the token and subscribe/mint at NAV to profit from the premium. Conversely, if it trades below NAV, buy the discounted token and hold until the price re-pegs or redeem at NAV.


Strategy 2: Cross-Chain Yield Arbitrage

Identify the same token (e.g., USDY) trading at different effective yields on two chains. For instance, USDY might yield 3.55% on Ethereum but 4.05% on Solana due to additional DeFi incentives. Bridge capital to the higher-yield environment to capture the differential.


Strategy 3: Stablecoin → RWA Rotation Trade

Monitor the yield spread between tokenized treasury tokens (e.g., USDY at 3.55%) and on-chain stablecoin lending rates (e.g., Aave USDC supply APY at ~2%). When the yield gap exceeds 1%, shift idle stablecoin holdings into the higher-yielding token. This is the simplest and lowest risk RWA strategy, often described as getting paid to wait. Frequency: monthly rebalance. Expected alpha: 1–3% annualized boost over holding plain USDC.


Strategy 4: Oracle Lag Front-Running

This is a high-frequency play. Track macro news events like Treasury auctions and FOMC decisions. If results suggest a bond rally, buy tokenized treasuries immediately before the on-chain oracle updates the price. The typical window is 2–4 hours. This strategy relies on speed and precise knowledge of the oracle’s update schedule. Occurs 8–12 times per year around scheduled macro events.


Strategy 5: DeFi Collateral Premium Capture

Deploy tokenized treasuries as margin on perpetuals exchanges (Deribit, Binance, Bybit) rather than plain stablecoins. Your collateral earns the risk-free rate (3.49–3.55% APY for USYC or USDY) while simultaneously being deployed in a leveraged position. If you are long BTC at a 10% annualized funding cost, but your collateral earns 4%, your effective financing cost drops to ~6%. At scale with $1M+ in collateral, this 2–4% annual boost compounds significantly.
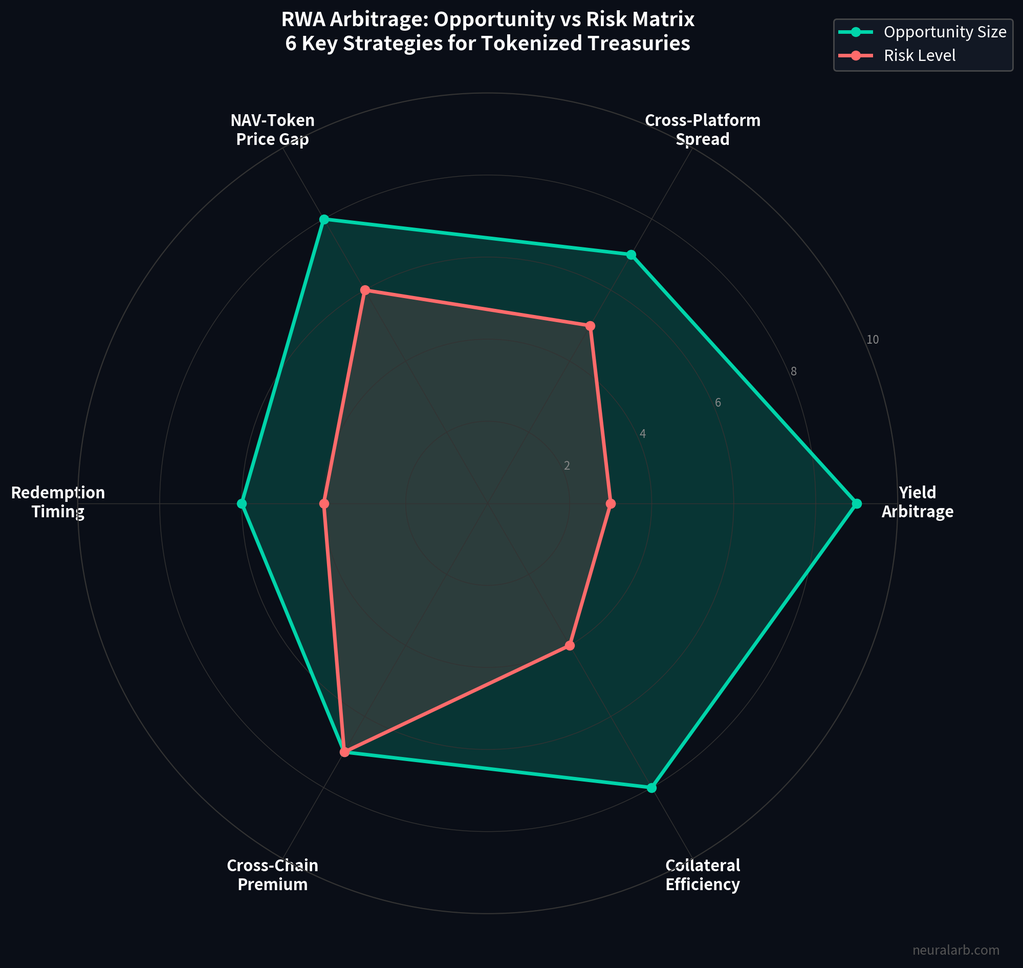
RWA Arbitrage: Opportunity vs Risk Matrix (Radar)
RWA Arbitrage Strategy Comparison - Risk, Return, and Accessibility Radar (March 2026)


5. Risks You Cannot Ignore


While attractive, RWA arbitrage is not risk-free. It introduces vectors that do not exist in pure crypto trading:


    • Smart Contract Risk: Even safe treasuries depend on code for minting and redemptions. Bugs can freeze assets. Mitigation: Stick to audited, battle-tested issuers.
    • Custodian Risk: The underlying assets are held by banks. If a custodian fails, token holders are bankruptcy claimants, not direct owners. Mitigation: Diversify across issuers.
    • Regulatory Risk: Tokenized securities rules vary by jurisdiction (SEC vs. MiCA). Regulators can freeze transfers. Mitigation: Ensure strict compliance and use compliant venues.
    • Oracle Risk: Delayed feeds can signal false prices. Attackers can delay updates to front-run corrections. Mitigation: Monitor multiple data sources.
    • Liquidity Risk: Secondary markets are thinner than DeFi blue chips. Large exits can cause slippage. Mitigation: Ladder entries and use primary redemption for large size.


6. How AI Amplifies RWA Arbitrage


Manual monitoring of NAV versus price across 200+ products on 9 different blockchains is functionally impossible for a human trader. This is where AI and Machine Learning provide a decisive edge.


AI systems offer:


    1. Real-time Multi-chain Monitoring: Simultaneously tracking Ethereum, Solana, Base, Stellar, and XDC for micro-discrepancies.
    2. Yield Spread Detection: Instantly flagging when Product X on Chain A offers a better risk-adjusted yield than Product Y on Chain B.
    3. Oracle Lag Prediction: ML models learn the specific update patterns of oracles, positioning capital before the update occurs.
    4. Macro Event Scanning: NLP models ingest Fed statements and auction data to compute implied NAV impacts milliseconds after release.

NeuralArB is purpose built for this environment. Unlike manual traders who might catch 2-3 opportunities a month, AI-driven systems can identify and execute on dozens of these structural inefficiencies monthly with risk-adjusted sizing.
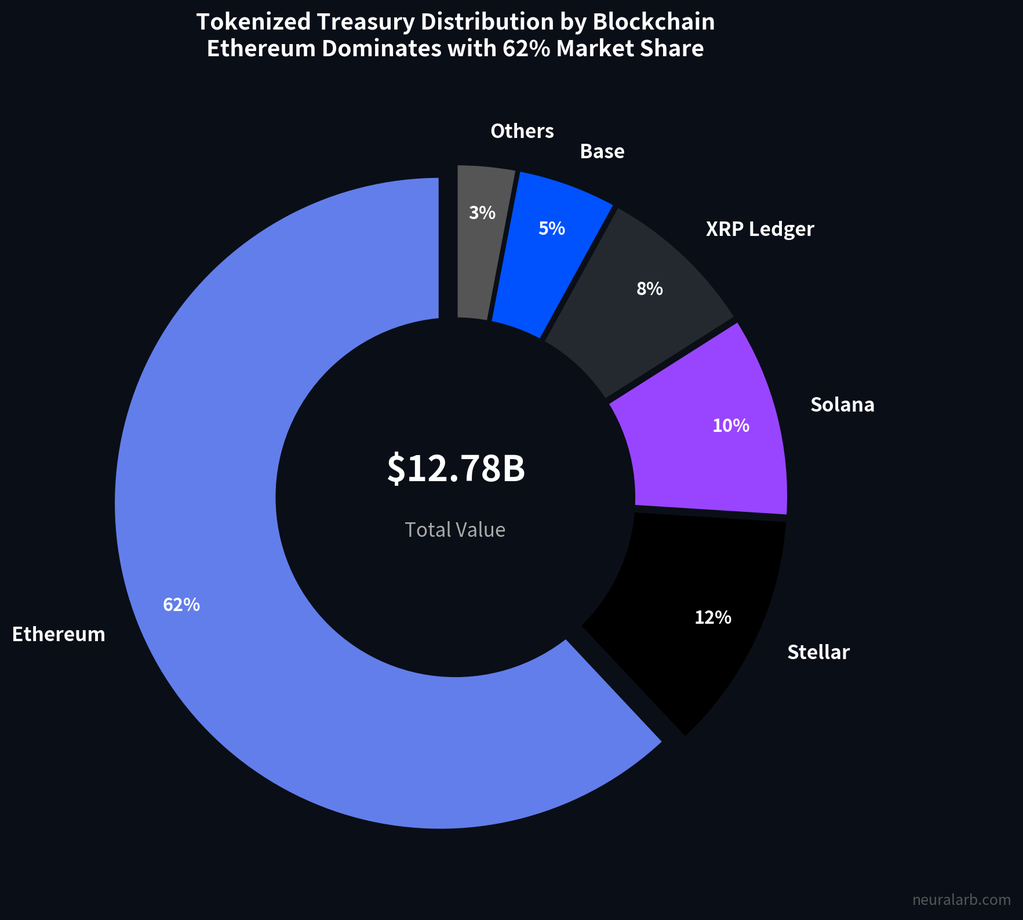
Blockchain Distribution of Tokenized Treasuries
Tokenized Treasury Distribution by Blockchain Network (March 2026)


7. The Complete Arbitrage Flow


The diagram below visualizes the end-to-end lifecycle of a typical NAV capture trade. Capital flows from a stablecoin (USDC) into the tokenized treasury asset, then into the secondary market to capture the premium, and finally back to profit.


The timeline varies from milliseconds (detection) to seconds (execution) to hours (holding period for NAV update). Success depends on the tight integration of oracle data, DEX execution, and smart contract interaction.
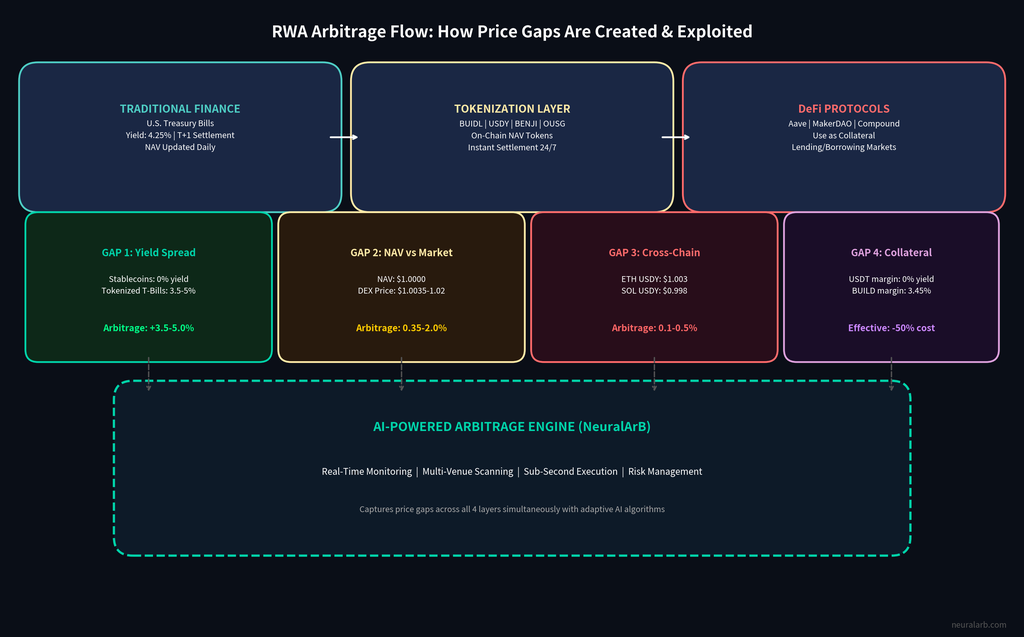
RWA Arbitrage Flow Diagram – How Price Gaps Form
End-to-End RWA Arbitrage Flow - From Signal Detection to Profit Capture


📥  8. Downloadable Data + Comparison Table


Our research team has compiled a comprehensive comparison of all major tokenized treasury products. This dataset covers 20 products across 8 key metrics, including Market Cap, Yield, Minimum Investment, and Arbitrage Type.


Preview of Key Market Players:


TokenIssuerMarket CapYield (7d)Min Inv.TypeChain
USYCCircle$2.66B1.82%$100KPermissionedEthereum
BUIDLBlackRock$2.20B3.45%$5MPermissionedEthereum
USDYOndo$1.64B3.55%$500PermissionlessMulti-chain
JTRSYJanus Henderson$1.07B5.04%$1MPermissionedEthereum
BENJIFranklin Templeton$1.02B3.50%NonePermissionlessStellar/ETH
WTGXXWisdomTree$832M3.49%Inst.PermissionedEthereum
OUSGOndo Finance$621M3.37%$5KSemi-permissionedMulti-chain
USTBOpenEden$618M3.48%$1KSemi-permissionedEthereum


9. Is RWA Arbitrage Right for You?


Not every strategy fits every trader. Here is a quick decision framework:


    • Retail Traders: Focus on Strategies 1 and 3 (NAV capture and Stablecoin Rotation). These offer lower complexity and require less capital.
    • Intermediate Traders: Consider adding Strategy 2 (Cross-Chain Yield Arb) once you are comfortable managing bridges and multi-chain wallets.
    • Sophisticated/Institutional: All 5 strategies are viable, with Oracle Lag and DeFi Collateral premiums offering the highest scalable returns.

Note: This is NOT suitable for traders seeking 100x degen returns, those uncomfortable with KYC/regulatory frameworks, or those with less than $10K in deployable capital.


Ready to Automate Your RWA Arbitrage Strategy?


NeuralArB’s AI-powered engine monitors 200+ tokenized treasury products across 9 blockchains in real time detecting yield gaps, NAV discrepancies, and cross-chain opportunities 24/7 so you don’t have to.


Conclusion


Tokenized treasuries represent more than just a new asset class; they are a structural convergence of TradFi yield and DeFi composability. The gaps they create are not random noise, they are born from systemic architecture: daily NAV updates, chain fragmentation, and access tiers.


For traders equipped with the right infrastructure, these gaps offer consistent, low-to-medium risk opportunities. The market is still early at $12.78B, it is large enough for real edge, but small enough that institutional arbitrageurs haven’t fully compressed all spreads. NeuralArB is positioned squarely at this intersection: AI-powered, multi-chain, and built for yield and gap detection.


The question is no longer can RWAs create arbitrage opportunities? — they already have. The question is: are you positioned to capture them?


💬 Frequently Asked Questions (FAQ)

What is RWA arbitrage?

RWA arbitrage exploits price inefficiencies between tokenized real world assets, such as US Treasury tokens, and their actual underlying value. These gaps arise from oracle delays, chain fragmentation, liquidity imbalances, and yield differentials between on-chain and off-chain instruments.

Major products like BlackRock BUIDL, Ondo USDY, and Franklin Templeton BENJI are backed 1:1 by actual US Treasury securities in regulated custodial accounts. However, risks include smart contract vulnerabilities, custodian failure, and regulatory changes. They are not FDIC insured.

BlackRock BUIDL requires a $5M minimum investment and is restricted to US accredited investors on Ethereum. Ondo USDY has a $500 minimum, is available permissionlessly on multiple chains, and currently yields ~3.55% — slightly higher than BUIDL’s 3.45% due to the access premium.

As of March 2026, the tokenized US Treasury market has reached approximately $12.78B, with the broader RWA market (excluding stablecoins) at over $24B. The market grew 266% in 2025 alone.

Five main mechanisms:

1) yield spread vs. sterile stablecoins,

2) chain fragmentation with different oracle speeds,

3) daily NAV updates vs. 24/7 trading,

4) access restrictions creating tiered pricing,

5) DeFi composability premiums when tokens are used as collateral.

Yes, but only lower-frequency strategies are viable manually: NAV discount/premium capture (weekly opportunities) and stablecoin rotation trades (monthly). Oracle lag front-running and collateral premium capture require automated monitoring tools like NeuralArB.

Ethereum dominates with ~65-70% of total tokenized treasury volume (BUIDL, USYC, OUSG, USTB). Solana is growing rapidly, particularly for retail-accessible products. Other active chains include Stellar (BENJI), Base, and BNB Chain.

As of March 2026, yields range from 1.82% (USYC) to 5.04% (JTRSY), with most major products clustered between 3.37% and 3.63%. JTRSY’s higher yield reflects longer duration and higher risk than short-duration T-bill products.

AI systems can simultaneously monitor 20+ products across 9 chains, detect oracle update patterns, scan macro news for NAV impact, calculate risk adjusted position sizes, and execute trades in seconds, tasks that are impossibly slow to do manually.

In most jurisdictions, yes — arbitraging price discrepancies between tokens is legal. However, certain products (like BUIDL) restrict who can hold and trade them. Always verify you meet the KYC/AML and accreditation requirements of each product before trading.


📱 Stay Connected:

  • Twitter/X for real-time market alerts
  • Telegram community for live trading discussions

🔗 Related Analysis:


Data Sources:

Disclaimer: This analysis is for educational purposes. Arbitrage trading involves substantial risk, including custody risk, regulatory risk, and execution risk. Past performance is not indicative of future results. Never risk capital you cannot afford to lose. Consult qualified financial and legal advisors before trading.

Mr.Q

Mr. Q is the Co-Founder & CEO of NeuralArB, where he spearheads the company’s strategic vision and growth initiatives. With a profound passion for blockchain technology, cryptocurrency trading, and artificial intelligence, Mr. Q has positioned NeuralArB as a leader in the AI-driven arbitrage trading space. Follow Mr. Q on Twitter: @LuisAlvaresQ

RWA Arbitrage Explained: Can Tokenized Treasuries and Funds Create New Price Gaps?

RWA Arbitrage Explained: Tokenized Treasury Price Gaps

The tokenized treasury market has exploded from under $200 million to over $12.78 billion in just three years. This isn’t just a story of adoption, it’s a story of market structure evolution. As of early 2026, the total Real-World Asset (RWA) sector grew 266% in a single year to surpass $24 billion in total value locked.


As major financial institutions wrap real-world yield bearing assets into on-chain tokens, a completely new class of arbitrage opportunity has emerged. These are not traditional crypto arbitrage gaps based on exchange inefficiencies. They are structural inefficiencies born from deep, systemic frictions:


    • Yield spreads between on-chain sterile assets (stablecoins) and off-chain yielding instruments.
    • Chain fragmentation where the same asset trades at different prices on Ethereum, Solana, and Base.
    • Liquidity asymmetry between institutional access tiers and retail permissionless markets.
    • Oracle lag creating known, exploitable mispricings during macro events.

The question for sophisticated traders is no longer if these gaps exist, but whether they can be consistently exploited. And in a market that never sleeps but relies on daily banking updates, how does AI fit into the execution equation?


1. What Is RWA Tokenization and Why Does It Matter for Arbitrage?


Real-World Assets (RWAs) are traditional financial instruments such as US Treasury bills, money market funds, corporate bonds, and real estate—that have been tokenized on a blockchain. The key distinction from synthetic assets is that tokenized RWAs are backed 1:1 by actual assets held in regulated custodial vaults.

How Tokenization Works

The issuer wraps the asset legally, a custodian holds the underlying securities (e.g., T-bills at BNY Mellon), a smart contract mints the corresponding token, and an oracle updates the Net Asset Value (NAV) typically once per daily cycle.

Major Products and Issuers


The landscape is dominated by a mix of traditional finance giants and crypto-native firms:


    • BlackRock BUIDL ($2.2B, Ethereum) — An institutional, permissioned fund.
    • Circle USYC ($2.66B, Ethereum) — A yield-bearing stablecoin structure.
    • Ondo USDY ($1.64B, Multi-chain) — A permissionless yield token structured as a secured note.
    • Franklin Templeton BENJI ($1.02B, Stellar+Ethereum) — One of the first regulated on-chain funds.
    • WisdomTree WTGXX ($832M) — Integrating traditional asset management with blockchain rails.
    • Ondo OUSG ($621M) — An institutional wrapper for BlackRock’s iShares ETFs.

Why this creates arbitrage: Unlike stablecoins (USDT/USDC) which are designed to always equal $1.00, tokenized treasuries have a variable NAV that reflects accrued interest. However, because the underlying asset markets (TradFi) close on weekends and holidays, and oracles often update only once per day, the token price does not always perfectly reflect instantaneous market conditions. This disconnect creates intraday gaps between the token’s trading price and its actual, realizable NAV.

Top 10 Tokenized Treasury Products by Market Cap
Top 10 Tokenized Treasury Products by Market Cap (March 2026)


2. The Market Size That Justifies a Strategy


Arbitrage strategies require liquidity to be scalable. In the past, RWA markets were too small to support serious capital deployment. That has changed dramatically.


According to data from RWA.xyz, the total market capitalization of tokenized treasuries stands at $12.78 billion as of March 2026. The broader RWA market, excluding stablecoins, exceeds $24 billion, driven by a staggering 266% growth rate in 2025 alone.

⚡ Growth Milestones

Tokenized US Treasuries have grown 50x from early 2024 to 2026. The sector started the year at $8.9 billion on Jan 1, 2026, and surged to over $10.8 billion by late January before hitting current highs. Projections place the market at over $14 billion by the end of 2026.

Furthermore, yields in private credit RWAs are tracking between 8–12%, compared to the risk-free rate of 3–5% for treasury tokens. This scale matters because larger markets mean more venues, deeper liquidity pools, and the ability to deploy significant capital without slippage eating the entire arbitrage edge.


PeriodMarket CapGrowth Driver
Early 2024~$200MEarly pilots (Franklin Templeton BENJI, Ondo OUSG)
Mid 2024~$1.3BBlackRock BUIDL launch; institutional FOMO begins
Early 2025~$4BFed rate hold keeps T-bill yields attractive
Jan 1, 2026$8.9BDeFi collateral adoption; BUIDL on Deribit/Binance
Late Jan 2026$10.8B+Circle USYC surges; Ondo tokenizes Franklin ETFs
March 2026$12.78BInstitutional mainstream; multi-chain expansion
Tokenized Treasury Market Growth Timeline (50x Growth)
Tokenized Treasury Market Growth Timeline 2022–2026 - From $200M to $12.78B+


3. Where the Price Gaps Actually Come From


These arbitrage opportunities are not random market noise. They are structural. Here are the five distinct mechanisms creating price gaps in the RWA market:


3.1 Yield Arbitrage: The “On-Chain Sterility” Gap


US T-bill yields have hovered between 4-5% through 2024-2025. Meanwhile, standard stablecoins like USDT and USDC offer 0% native yield to holders. Tokenized T-bills, by contrast, offer 3.0-5.1%.


This creates massive hydraulic pressure to move capital from sterile stablecoins into tokenized yield. During periods of high demand, this rotation creates temporary surges where token prices trade slightly above their NAV. Arbitrageurs can buy USDT (trading at par), mint or swap into the yielding token, and capture the premium.


3.2 Chain Fragmentation Gaps


The same asset often trades on different chains at different prices. Ondo’s USDY, for example, is available on Ethereum, Solana, Aptos, and Sui. However, the oracle updates and DEX liquidity pools on these chains operate independently.


Real example: During a rate-change news event, Solana DEX updates lagged Ethereum price discovery by roughly 15 minutes. For that window, USDY on Solana traded at a 0.3% premium compared to Ethereum. Automated bots bridged capital to sell into the Solana premium and buy back on Ethereum.

3.3 Oracle Lag and NAV Update Gaps


Most tokenized treasury NAVs update daily. However, intraday interest rate news, such as FOMC decisions or Treasury auction results changes the implied value of the underlying assets instantly. This creates a 2-4 hour window of known mispricing.


If the Fed signals a rate cut at 2:00 PM ET, the value of the underlying bond portfolio increases immediately. But the on-chain NAV update might not happen until 5:00 PM or the next morning. Traders who predict this update can front run the oracle by buying the token at the stale price.


3.4 Liquidity Tier Gaps: Institutional vs. Retail Access


BlackRock’s BUIDL has a $5 million minimum investment and restricts access to accredited investors. Retail equivalents like USDY have no minimums. This creates a two tier market.


The spread between BUIDL’s yield (3.45%) and retail-accessible USDY (3.55%) reflects an institutional access premium. Protocols that “wrap” BUIDL for retail DeFi use effectively capture this spread by bridging the liquidity gap.


3.5 DeFi Composability Premiums


When tokenized treasuries are accepted as collateral on major exchanges like Deribit or Binance, traders are willing to pay a premium for them. Why? Because posting BUIDL as margin earns you yield, whereas posting USDC does not.


This collateral efficiency premium can push token prices 0.1-0.5% above NAV during bull markets when leverage demand is high. Timing entry and exit around these collateral demand cycles is a consistent edge.

Tokenized Treasury Yields vs Federal Funds Rate
Yield Comparison: Tokenized Treasury Products vs. Traditional Cash (March 2026)


4. The 5 RWA Arbitrage Strategies in Depth


Below are the five primary strategies deployed by sophisticated desks and AI systems:


StrategyMechanismCapital Req.RiskEst. Edge
NAV CaptureBuy/Sell vs. Daily NAV rebase$50K – $500KLow-Med0.2% – 0.8%
Cross-Chain ArbExploit price/yield diffs across chains$100K – $1MBridge Risk0.3% – 1.0% / mo
Stablecoin RotationYield farming vs. lending rates$25K+Low1% – 3% APY boost
Oracle Front-RunTrade ahead of NAV updates on macro news$50K+Execution0.2% – 0.5% / event
Collateral ArbEarn yield on margin + funding rates$100K+Market Exp.2% – 4% APY boost


Strategy 1: NAV Discount/Premium Capture

Monitor secondary market prices against the officially announced NAV. When a token trades >0.3% above NAV, sell the token and subscribe/mint at NAV to profit from the premium. Conversely, if it trades below NAV, buy the discounted token and hold until the price re-pegs or redeem at NAV.


Strategy 2: Cross-Chain Yield Arbitrage

Identify the same token (e.g., USDY) trading at different effective yields on two chains. For instance, USDY might yield 3.55% on Ethereum but 4.05% on Solana due to additional DeFi incentives. Bridge capital to the higher-yield environment to capture the differential.


Strategy 3: Stablecoin → RWA Rotation Trade

Monitor the yield spread between tokenized treasury tokens (e.g., USDY at 3.55%) and on-chain stablecoin lending rates (e.g., Aave USDC supply APY at ~2%). When the yield gap exceeds 1%, shift idle stablecoin holdings into the higher-yielding token. This is the simplest and lowest risk RWA strategy, often described as getting paid to wait. Frequency: monthly rebalance. Expected alpha: 1–3% annualized boost over holding plain USDC.


Strategy 4: Oracle Lag Front-Running

This is a high-frequency play. Track macro news events like Treasury auctions and FOMC decisions. If results suggest a bond rally, buy tokenized treasuries immediately before the on-chain oracle updates the price. The typical window is 2–4 hours. This strategy relies on speed and precise knowledge of the oracle’s update schedule. Occurs 8–12 times per year around scheduled macro events.


Strategy 5: DeFi Collateral Premium Capture

Deploy tokenized treasuries as margin on perpetuals exchanges (Deribit, Binance, Bybit) rather than plain stablecoins. Your collateral earns the risk-free rate (3.49–3.55% APY for USYC or USDY) while simultaneously being deployed in a leveraged position. If you are long BTC at a 10% annualized funding cost, but your collateral earns 4%, your effective financing cost drops to ~6%. At scale with $1M+ in collateral, this 2–4% annual boost compounds significantly.

RWA Arbitrage: Opportunity vs Risk Matrix (Radar)
RWA Arbitrage Strategy Comparison - Risk, Return, and Accessibility Radar (March 2026)


5. Risks You Cannot Ignore


While attractive, RWA arbitrage is not risk-free. It introduces vectors that do not exist in pure crypto trading:


    • Smart Contract Risk: Even safe treasuries depend on code for minting and redemptions. Bugs can freeze assets. Mitigation: Stick to audited, battle-tested issuers.
    • Custodian Risk: The underlying assets are held by banks. If a custodian fails, token holders are bankruptcy claimants, not direct owners. Mitigation: Diversify across issuers.
    • Regulatory Risk: Tokenized securities rules vary by jurisdiction (SEC vs. MiCA). Regulators can freeze transfers. Mitigation: Ensure strict compliance and use compliant venues.
    • Oracle Risk: Delayed feeds can signal false prices. Attackers can delay updates to front-run corrections. Mitigation: Monitor multiple data sources.
    • Liquidity Risk: Secondary markets are thinner than DeFi blue chips. Large exits can cause slippage. Mitigation: Ladder entries and use primary redemption for large size.


6. How AI Amplifies RWA Arbitrage


Manual monitoring of NAV versus price across 200+ products on 9 different blockchains is functionally impossible for a human trader. This is where AI and Machine Learning provide a decisive edge.


AI systems offer:


    1. Real-time Multi-chain Monitoring: Simultaneously tracking Ethereum, Solana, Base, Stellar, and XDC for micro-discrepancies.
    2. Yield Spread Detection: Instantly flagging when Product X on Chain A offers a better risk-adjusted yield than Product Y on Chain B.
    3. Oracle Lag Prediction: ML models learn the specific update patterns of oracles, positioning capital before the update occurs.
    4. Macro Event Scanning: NLP models ingest Fed statements and auction data to compute implied NAV impacts milliseconds after release.

NeuralArB is purpose built for this environment. Unlike manual traders who might catch 2-3 opportunities a month, AI-driven systems can identify and execute on dozens of these structural inefficiencies monthly with risk-adjusted sizing.

Blockchain Distribution of Tokenized Treasuries
Tokenized Treasury Distribution by Blockchain Network (March 2026)


7. The Complete Arbitrage Flow


The diagram below visualizes the end-to-end lifecycle of a typical NAV capture trade. Capital flows from a stablecoin (USDC) into the tokenized treasury asset, then into the secondary market to capture the premium, and finally back to profit.


The timeline varies from milliseconds (detection) to seconds (execution) to hours (holding period for NAV update). Success depends on the tight integration of oracle data, DEX execution, and smart contract interaction.

RWA Arbitrage Flow Diagram – How Price Gaps Form
End-to-End RWA Arbitrage Flow - From Signal Detection to Profit Capture


📥  8. Downloadable Data + Comparison Table


Our research team has compiled a comprehensive comparison of all major tokenized treasury products. This dataset covers 20 products across 8 key metrics, including Market Cap, Yield, Minimum Investment, and Arbitrage Type.


Preview of Key Market Players:


TokenIssuerMarket CapYield (7d)Min Inv.TypeChain
USYCCircle$2.66B1.82%$100KPermissionedEthereum
BUIDLBlackRock$2.20B3.45%$5MPermissionedEthereum
USDYOndo$1.64B3.55%$500PermissionlessMulti-chain
JTRSYJanus Henderson$1.07B5.04%$1MPermissionedEthereum
BENJIFranklin Templeton$1.02B3.50%NonePermissionlessStellar/ETH
WTGXXWisdomTree$832M3.49%Inst.PermissionedEthereum
OUSGOndo Finance$621M3.37%$5KSemi-permissionedMulti-chain
USTBOpenEden$618M3.48%$1KSemi-permissionedEthereum


9. Is RWA Arbitrage Right for You?


Not every strategy fits every trader. Here is a quick decision framework:


    • Retail Traders: Focus on Strategies 1 and 3 (NAV capture and Stablecoin Rotation). These offer lower complexity and require less capital.
    • Intermediate Traders: Consider adding Strategy 2 (Cross-Chain Yield Arb) once you are comfortable managing bridges and multi-chain wallets.
    • Sophisticated/Institutional: All 5 strategies are viable, with Oracle Lag and DeFi Collateral premiums offering the highest scalable returns.

Note: This is NOT suitable for traders seeking 100x degen returns, those uncomfortable with KYC/regulatory frameworks, or those with less than $10K in deployable capital.


Ready to Automate Your RWA Arbitrage Strategy?


NeuralArB’s AI-powered engine monitors 200+ tokenized treasury products across 9 blockchains in real time detecting yield gaps, NAV discrepancies, and cross-chain opportunities 24/7 so you don’t have to.


Conclusion


Tokenized treasuries represent more than just a new asset class; they are a structural convergence of TradFi yield and DeFi composability. The gaps they create are not random noise, they are born from systemic architecture: daily NAV updates, chain fragmentation, and access tiers.


For traders equipped with the right infrastructure, these gaps offer consistent, low-to-medium risk opportunities. The market is still early at $12.78B, it is large enough for real edge, but small enough that institutional arbitrageurs haven’t fully compressed all spreads. NeuralArB is positioned squarely at this intersection: AI-powered, multi-chain, and built for yield and gap detection.


The question is no longer can RWAs create arbitrage opportunities? — they already have. The question is: are you positioned to capture them?


💬 Frequently Asked Questions (FAQ)

What is RWA arbitrage?

RWA arbitrage exploits price inefficiencies between tokenized real world assets, such as US Treasury tokens, and their actual underlying value. These gaps arise from oracle delays, chain fragmentation, liquidity imbalances, and yield differentials between on-chain and off-chain instruments.

Major products like BlackRock BUIDL, Ondo USDY, and Franklin Templeton BENJI are backed 1:1 by actual US Treasury securities in regulated custodial accounts. However, risks include smart contract vulnerabilities, custodian failure, and regulatory changes. They are not FDIC insured.

BlackRock BUIDL requires a $5M minimum investment and is restricted to US accredited investors on Ethereum. Ondo USDY has a $500 minimum, is available permissionlessly on multiple chains, and currently yields ~3.55% — slightly higher than BUIDL’s 3.45% due to the access premium.

As of March 2026, the tokenized US Treasury market has reached approximately $12.78B, with the broader RWA market (excluding stablecoins) at over $24B. The market grew 266% in 2025 alone.

Five main mechanisms:

1) yield spread vs. sterile stablecoins,

2) chain fragmentation with different oracle speeds,

3) daily NAV updates vs. 24/7 trading,

4) access restrictions creating tiered pricing,

5) DeFi composability premiums when tokens are used as collateral.

Yes, but only lower-frequency strategies are viable manually: NAV discount/premium capture (weekly opportunities) and stablecoin rotation trades (monthly). Oracle lag front-running and collateral premium capture require automated monitoring tools like NeuralArB.

Ethereum dominates with ~65-70% of total tokenized treasury volume (BUIDL, USYC, OUSG, USTB). Solana is growing rapidly, particularly for retail-accessible products. Other active chains include Stellar (BENJI), Base, and BNB Chain.

As of March 2026, yields range from 1.82% (USYC) to 5.04% (JTRSY), with most major products clustered between 3.37% and 3.63%. JTRSY’s higher yield reflects longer duration and higher risk than short-duration T-bill products.

AI systems can simultaneously monitor 20+ products across 9 chains, detect oracle update patterns, scan macro news for NAV impact, calculate risk adjusted position sizes, and execute trades in seconds, tasks that are impossibly slow to do manually.

In most jurisdictions, yes — arbitraging price discrepancies between tokens is legal. However, certain products (like BUIDL) restrict who can hold and trade them. Always verify you meet the KYC/AML and accreditation requirements of each product before trading.


📱 Stay Connected:

  • Twitter/X for real-time market alerts
  • Telegram community for live trading discussions

🔗 Related Analysis:


Data Sources:

Disclaimer: This analysis is for educational purposes. Arbitrage trading involves substantial risk, including custody risk, regulatory risk, and execution risk. Past performance is not indicative of future results. Never risk capital you cannot afford to lose. Consult qualified financial and legal advisors before trading.

Mr.Q

Mr. Q is the Co-Founder & CEO of NeuralArB, where he spearheads the company’s strategic vision and growth initiatives. With a profound passion for blockchain technology, cryptocurrency trading, and artificial intelligence, Mr. Q has positioned NeuralArB as a leader in the AI-driven arbitrage trading space. Follow Mr. Q on Twitter: @LuisAlvaresQ

RWA Arbitrage Explained: Can Tokenized Treasuries and Funds Create New Price Gaps?

RWA Arbitrage Explained: Tokenized Treasury Price Gaps

The tokenized treasury market has exploded from under $200 million to over $12.78 billion in just three years. This isn’t just a story of adoption, it’s a story of market structure evolution. As of early 2026, the total Real-World Asset (RWA) sector grew 266% in a single year to surpass $24 billion in total value locked.


As major financial institutions wrap real-world yield bearing assets into on-chain tokens, a completely new class of arbitrage opportunity has emerged. These are not traditional crypto arbitrage gaps based on exchange inefficiencies. They are structural inefficiencies born from deep, systemic frictions:


    • Yield spreads between on-chain sterile assets (stablecoins) and off-chain yielding instruments.
    • Chain fragmentation where the same asset trades at different prices on Ethereum, Solana, and Base.
    • Liquidity asymmetry between institutional access tiers and retail permissionless markets.
    • Oracle lag creating known, exploitable mispricings during macro events.

The question for sophisticated traders is no longer if these gaps exist, but whether they can be consistently exploited. And in a market that never sleeps but relies on daily banking updates, how does AI fit into the execution equation?


1. What Is RWA Tokenization and Why Does It Matter for Arbitrage?


Real-World Assets (RWAs) are traditional financial instruments such as US Treasury bills, money market funds, corporate bonds, and real estate—that have been tokenized on a blockchain. The key distinction from synthetic assets is that tokenized RWAs are backed 1:1 by actual assets held in regulated custodial vaults.

How Tokenization Works

The issuer wraps the asset legally, a custodian holds the underlying securities (e.g., T-bills at BNY Mellon), a smart contract mints the corresponding token, and an oracle updates the Net Asset Value (NAV) typically once per daily cycle.

Major Products and Issuers


The landscape is dominated by a mix of traditional finance giants and crypto-native firms:


    • BlackRock BUIDL ($2.2B, Ethereum) — An institutional, permissioned fund.
    • Circle USYC ($2.66B, Ethereum) — A yield-bearing stablecoin structure.
    • Ondo USDY ($1.64B, Multi-chain) — A permissionless yield token structured as a secured note.
    • Franklin Templeton BENJI ($1.02B, Stellar+Ethereum) — One of the first regulated on-chain funds.
    • WisdomTree WTGXX ($832M) — Integrating traditional asset management with blockchain rails.
    • Ondo OUSG ($621M) — An institutional wrapper for BlackRock’s iShares ETFs.

Why this creates arbitrage: Unlike stablecoins (USDT/USDC) which are designed to always equal $1.00, tokenized treasuries have a variable NAV that reflects accrued interest. However, because the underlying asset markets (TradFi) close on weekends and holidays, and oracles often update only once per day, the token price does not always perfectly reflect instantaneous market conditions. This disconnect creates intraday gaps between the token’s trading price and its actual, realizable NAV.

Top 10 Tokenized Treasury Products by Market Cap
Top 10 Tokenized Treasury Products by Market Cap (March 2026)


2. The Market Size That Justifies a Strategy


Arbitrage strategies require liquidity to be scalable. In the past, RWA markets were too small to support serious capital deployment. That has changed dramatically.


According to data from RWA.xyz, the total market capitalization of tokenized treasuries stands at $12.78 billion as of March 2026. The broader RWA market, excluding stablecoins, exceeds $24 billion, driven by a staggering 266% growth rate in 2025 alone.

⚡ Growth Milestones

Tokenized US Treasuries have grown 50x from early 2024 to 2026. The sector started the year at $8.9 billion on Jan 1, 2026, and surged to over $10.8 billion by late January before hitting current highs. Projections place the market at over $14 billion by the end of 2026.

Furthermore, yields in private credit RWAs are tracking between 8–12%, compared to the risk-free rate of 3–5% for treasury tokens. This scale matters because larger markets mean more venues, deeper liquidity pools, and the ability to deploy significant capital without slippage eating the entire arbitrage edge.


PeriodMarket CapGrowth Driver
Early 2024~$200MEarly pilots (Franklin Templeton BENJI, Ondo OUSG)
Mid 2024~$1.3BBlackRock BUIDL launch; institutional FOMO begins
Early 2025~$4BFed rate hold keeps T-bill yields attractive
Jan 1, 2026$8.9BDeFi collateral adoption; BUIDL on Deribit/Binance
Late Jan 2026$10.8B+Circle USYC surges; Ondo tokenizes Franklin ETFs
March 2026$12.78BInstitutional mainstream; multi-chain expansion
Tokenized Treasury Market Growth Timeline (50x Growth)
Tokenized Treasury Market Growth Timeline 2022–2026 - From $200M to $12.78B+


3. Where the Price Gaps Actually Come From


These arbitrage opportunities are not random market noise. They are structural. Here are the five distinct mechanisms creating price gaps in the RWA market:


3.1 Yield Arbitrage: The “On-Chain Sterility” Gap


US T-bill yields have hovered between 4-5% through 2024-2025. Meanwhile, standard stablecoins like USDT and USDC offer 0% native yield to holders. Tokenized T-bills, by contrast, offer 3.0-5.1%.


This creates massive hydraulic pressure to move capital from sterile stablecoins into tokenized yield. During periods of high demand, this rotation creates temporary surges where token prices trade slightly above their NAV. Arbitrageurs can buy USDT (trading at par), mint or swap into the yielding token, and capture the premium.


3.2 Chain Fragmentation Gaps


The same asset often trades on different chains at different prices. Ondo’s USDY, for example, is available on Ethereum, Solana, Aptos, and Sui. However, the oracle updates and DEX liquidity pools on these chains operate independently.


Real example: During a rate-change news event, Solana DEX updates lagged Ethereum price discovery by roughly 15 minutes. For that window, USDY on Solana traded at a 0.3% premium compared to Ethereum. Automated bots bridged capital to sell into the Solana premium and buy back on Ethereum.

3.3 Oracle Lag and NAV Update Gaps


Most tokenized treasury NAVs update daily. However, intraday interest rate news, such as FOMC decisions or Treasury auction results changes the implied value of the underlying assets instantly. This creates a 2-4 hour window of known mispricing.


If the Fed signals a rate cut at 2:00 PM ET, the value of the underlying bond portfolio increases immediately. But the on-chain NAV update might not happen until 5:00 PM or the next morning. Traders who predict this update can front run the oracle by buying the token at the stale price.


3.4 Liquidity Tier Gaps: Institutional vs. Retail Access


BlackRock’s BUIDL has a $5 million minimum investment and restricts access to accredited investors. Retail equivalents like USDY have no minimums. This creates a two tier market.


The spread between BUIDL’s yield (3.45%) and retail-accessible USDY (3.55%) reflects an institutional access premium. Protocols that “wrap” BUIDL for retail DeFi use effectively capture this spread by bridging the liquidity gap.


3.5 DeFi Composability Premiums


When tokenized treasuries are accepted as collateral on major exchanges like Deribit or Binance, traders are willing to pay a premium for them. Why? Because posting BUIDL as margin earns you yield, whereas posting USDC does not.


This collateral efficiency premium can push token prices 0.1-0.5% above NAV during bull markets when leverage demand is high. Timing entry and exit around these collateral demand cycles is a consistent edge.

Tokenized Treasury Yields vs Federal Funds Rate
Yield Comparison: Tokenized Treasury Products vs. Traditional Cash (March 2026)


4. The 5 RWA Arbitrage Strategies in Depth


Below are the five primary strategies deployed by sophisticated desks and AI systems:


StrategyMechanismCapital Req.RiskEst. Edge
NAV CaptureBuy/Sell vs. Daily NAV rebase$50K – $500KLow-Med0.2% – 0.8%
Cross-Chain ArbExploit price/yield diffs across chains$100K – $1MBridge Risk0.3% – 1.0% / mo
Stablecoin RotationYield farming vs. lending rates$25K+Low1% – 3% APY boost
Oracle Front-RunTrade ahead of NAV updates on macro news$50K+Execution0.2% – 0.5% / event
Collateral ArbEarn yield on margin + funding rates$100K+Market Exp.2% – 4% APY boost


Strategy 1: NAV Discount/Premium Capture

Monitor secondary market prices against the officially announced NAV. When a token trades >0.3% above NAV, sell the token and subscribe/mint at NAV to profit from the premium. Conversely, if it trades below NAV, buy the discounted token and hold until the price re-pegs or redeem at NAV.


Strategy 2: Cross-Chain Yield Arbitrage

Identify the same token (e.g., USDY) trading at different effective yields on two chains. For instance, USDY might yield 3.55% on Ethereum but 4.05% on Solana due to additional DeFi incentives. Bridge capital to the higher-yield environment to capture the differential.


Strategy 3: Stablecoin → RWA Rotation Trade

Monitor the yield spread between tokenized treasury tokens (e.g., USDY at 3.55%) and on-chain stablecoin lending rates (e.g., Aave USDC supply APY at ~2%). When the yield gap exceeds 1%, shift idle stablecoin holdings into the higher-yielding token. This is the simplest and lowest risk RWA strategy, often described as getting paid to wait. Frequency: monthly rebalance. Expected alpha: 1–3% annualized boost over holding plain USDC.


Strategy 4: Oracle Lag Front-Running

This is a high-frequency play. Track macro news events like Treasury auctions and FOMC decisions. If results suggest a bond rally, buy tokenized treasuries immediately before the on-chain oracle updates the price. The typical window is 2–4 hours. This strategy relies on speed and precise knowledge of the oracle’s update schedule. Occurs 8–12 times per year around scheduled macro events.


Strategy 5: DeFi Collateral Premium Capture

Deploy tokenized treasuries as margin on perpetuals exchanges (Deribit, Binance, Bybit) rather than plain stablecoins. Your collateral earns the risk-free rate (3.49–3.55% APY for USYC or USDY) while simultaneously being deployed in a leveraged position. If you are long BTC at a 10% annualized funding cost, but your collateral earns 4%, your effective financing cost drops to ~6%. At scale with $1M+ in collateral, this 2–4% annual boost compounds significantly.

RWA Arbitrage: Opportunity vs Risk Matrix (Radar)
RWA Arbitrage Strategy Comparison - Risk, Return, and Accessibility Radar (March 2026)


5. Risks You Cannot Ignore


While attractive, RWA arbitrage is not risk-free. It introduces vectors that do not exist in pure crypto trading:


    • Smart Contract Risk: Even safe treasuries depend on code for minting and redemptions. Bugs can freeze assets. Mitigation: Stick to audited, battle-tested issuers.
    • Custodian Risk: The underlying assets are held by banks. If a custodian fails, token holders are bankruptcy claimants, not direct owners. Mitigation: Diversify across issuers.
    • Regulatory Risk: Tokenized securities rules vary by jurisdiction (SEC vs. MiCA). Regulators can freeze transfers. Mitigation: Ensure strict compliance and use compliant venues.
    • Oracle Risk: Delayed feeds can signal false prices. Attackers can delay updates to front-run corrections. Mitigation: Monitor multiple data sources.
    • Liquidity Risk: Secondary markets are thinner than DeFi blue chips. Large exits can cause slippage. Mitigation: Ladder entries and use primary redemption for large size.


6. How AI Amplifies RWA Arbitrage


Manual monitoring of NAV versus price across 200+ products on 9 different blockchains is functionally impossible for a human trader. This is where AI and Machine Learning provide a decisive edge.


AI systems offer:


    1. Real-time Multi-chain Monitoring: Simultaneously tracking Ethereum, Solana, Base, Stellar, and XDC for micro-discrepancies.
    2. Yield Spread Detection: Instantly flagging when Product X on Chain A offers a better risk-adjusted yield than Product Y on Chain B.
    3. Oracle Lag Prediction: ML models learn the specific update patterns of oracles, positioning capital before the update occurs.
    4. Macro Event Scanning: NLP models ingest Fed statements and auction data to compute implied NAV impacts milliseconds after release.

NeuralArB is purpose built for this environment. Unlike manual traders who might catch 2-3 opportunities a month, AI-driven systems can identify and execute on dozens of these structural inefficiencies monthly with risk-adjusted sizing.

Blockchain Distribution of Tokenized Treasuries
Tokenized Treasury Distribution by Blockchain Network (March 2026)


7. The Complete Arbitrage Flow


The diagram below visualizes the end-to-end lifecycle of a typical NAV capture trade. Capital flows from a stablecoin (USDC) into the tokenized treasury asset, then into the secondary market to capture the premium, and finally back to profit.


The timeline varies from milliseconds (detection) to seconds (execution) to hours (holding period for NAV update). Success depends on the tight integration of oracle data, DEX execution, and smart contract interaction.

RWA Arbitrage Flow Diagram – How Price Gaps Form
End-to-End RWA Arbitrage Flow - From Signal Detection to Profit Capture


📥  8. Downloadable Data + Comparison Table


Our research team has compiled a comprehensive comparison of all major tokenized treasury products. This dataset covers 20 products across 8 key metrics, including Market Cap, Yield, Minimum Investment, and Arbitrage Type.


Preview of Key Market Players:


TokenIssuerMarket CapYield (7d)Min Inv.TypeChain
USYCCircle$2.66B1.82%$100KPermissionedEthereum
BUIDLBlackRock$2.20B3.45%$5MPermissionedEthereum
USDYOndo$1.64B3.55%$500PermissionlessMulti-chain
JTRSYJanus Henderson$1.07B5.04%$1MPermissionedEthereum
BENJIFranklin Templeton$1.02B3.50%NonePermissionlessStellar/ETH
WTGXXWisdomTree$832M3.49%Inst.PermissionedEthereum
OUSGOndo Finance$621M3.37%$5KSemi-permissionedMulti-chain
USTBOpenEden$618M3.48%$1KSemi-permissionedEthereum


9. Is RWA Arbitrage Right for You?


Not every strategy fits every trader. Here is a quick decision framework:


    • Retail Traders: Focus on Strategies 1 and 3 (NAV capture and Stablecoin Rotation). These offer lower complexity and require less capital.
    • Intermediate Traders: Consider adding Strategy 2 (Cross-Chain Yield Arb) once you are comfortable managing bridges and multi-chain wallets.
    • Sophisticated/Institutional: All 5 strategies are viable, with Oracle Lag and DeFi Collateral premiums offering the highest scalable returns.

Note: This is NOT suitable for traders seeking 100x degen returns, those uncomfortable with KYC/regulatory frameworks, or those with less than $10K in deployable capital.


Ready to Automate Your RWA Arbitrage Strategy?


NeuralArB’s AI-powered engine monitors 200+ tokenized treasury products across 9 blockchains in real time detecting yield gaps, NAV discrepancies, and cross-chain opportunities 24/7 so you don’t have to.


Conclusion


Tokenized treasuries represent more than just a new asset class; they are a structural convergence of TradFi yield and DeFi composability. The gaps they create are not random noise, they are born from systemic architecture: daily NAV updates, chain fragmentation, and access tiers.


For traders equipped with the right infrastructure, these gaps offer consistent, low-to-medium risk opportunities. The market is still early at $12.78B, it is large enough for real edge, but small enough that institutional arbitrageurs haven’t fully compressed all spreads. NeuralArB is positioned squarely at this intersection: AI-powered, multi-chain, and built for yield and gap detection.


The question is no longer can RWAs create arbitrage opportunities? — they already have. The question is: are you positioned to capture them?


💬 Frequently Asked Questions (FAQ)

What is RWA arbitrage?

RWA arbitrage exploits price inefficiencies between tokenized real world assets, such as US Treasury tokens, and their actual underlying value. These gaps arise from oracle delays, chain fragmentation, liquidity imbalances, and yield differentials between on-chain and off-chain instruments.

Major products like BlackRock BUIDL, Ondo USDY, and Franklin Templeton BENJI are backed 1:1 by actual US Treasury securities in regulated custodial accounts. However, risks include smart contract vulnerabilities, custodian failure, and regulatory changes. They are not FDIC insured.

BlackRock BUIDL requires a $5M minimum investment and is restricted to US accredited investors on Ethereum. Ondo USDY has a $500 minimum, is available permissionlessly on multiple chains, and currently yields ~3.55% — slightly higher than BUIDL’s 3.45% due to the access premium.

As of March 2026, the tokenized US Treasury market has reached approximately $12.78B, with the broader RWA market (excluding stablecoins) at over $24B. The market grew 266% in 2025 alone.

Five main mechanisms:

1) yield spread vs. sterile stablecoins,

2) chain fragmentation with different oracle speeds,

3) daily NAV updates vs. 24/7 trading,

4) access restrictions creating tiered pricing,

5) DeFi composability premiums when tokens are used as collateral.

Yes, but only lower-frequency strategies are viable manually: NAV discount/premium capture (weekly opportunities) and stablecoin rotation trades (monthly). Oracle lag front-running and collateral premium capture require automated monitoring tools like NeuralArB.

Ethereum dominates with ~65-70% of total tokenized treasury volume (BUIDL, USYC, OUSG, USTB). Solana is growing rapidly, particularly for retail-accessible products. Other active chains include Stellar (BENJI), Base, and BNB Chain.

As of March 2026, yields range from 1.82% (USYC) to 5.04% (JTRSY), with most major products clustered between 3.37% and 3.63%. JTRSY’s higher yield reflects longer duration and higher risk than short-duration T-bill products.

AI systems can simultaneously monitor 20+ products across 9 chains, detect oracle update patterns, scan macro news for NAV impact, calculate risk adjusted position sizes, and execute trades in seconds, tasks that are impossibly slow to do manually.

In most jurisdictions, yes — arbitraging price discrepancies between tokens is legal. However, certain products (like BUIDL) restrict who can hold and trade them. Always verify you meet the KYC/AML and accreditation requirements of each product before trading.


📱 Stay Connected:

  • Twitter/X for real-time market alerts
  • Telegram community for live trading discussions

🔗 Related Analysis:


Data Sources:

Disclaimer: This analysis is for educational purposes. Arbitrage trading involves substantial risk, including custody risk, regulatory risk, and execution risk. Past performance is not indicative of future results. Never risk capital you cannot afford to lose. Consult qualified financial and legal advisors before trading.

Mr.Q

Mr. Q is the Co-Founder & CEO of NeuralArB, where he spearheads the company’s strategic vision and growth initiatives. With a profound passion for blockchain technology, cryptocurrency trading, and artificial intelligence, Mr. Q has positioned NeuralArB as a leader in the AI-driven arbitrage trading space. Follow Mr. Q on Twitter: @LuisAlvaresQ

Still have questions, contact us:

© 2026 NAB CONSULTANCY LTD. All right reserved.

These materials are for general information purposes only and are not investment advice or a recommendation or solicitation to buy, sell or hold any cryptoasset or to engage in any specific trading strategy. Some crypto products and markets are unregulated, and you may not be protected by government compensation and/or regulatory protection schemes. The unpredictable nature of the cryptoasset markets can lead to loss of funds. Tax may be payable on any return and/or on any increase in the value of your cryptoassets and you should seek independent advice on your taxation position.

All trademarks, logos, and brand names are the property of their respective owners. All company, product, and service names used in this website are for identification purposes only. Use of these names, trademarks, and brands does not imply endorsement.

NAB does not provide investment or brokerage services. All cryptocurrency spot, margin, and futures products are offered by third-party platforms. Products and services availability varies by country.

Past performance, whether actual or indicated by historical or simulated tests of strategies, is no guarantee of future performance or success. There is a possibility that you may sustain a loss equal to or greater than your entire investment regardless of which asset class you trade (i.e. cryptocurrency); therefore, you should not invest or risk money that you cannot afford to lose. Online trading is not suitable for all investors. Before trading any asset class, customers should review NFA and CFTC advisories, and other relevant disclosures. System access, trade placement, and execution may be delayed or fail due to market volatility and volume, quote delays, system and software errors, Internet traffic, outages and other unforeseen factors.

Still have questions, contact us:

© 2026 NAB CONSULTANCY LTD. All right reserved.

These materials are for general information purposes only and are not investment advice or a recommendation or solicitation to buy, sell or hold any cryptoasset or to engage in any specific trading strategy. Some crypto products and markets are unregulated, and you may not be protected by government compensation and/or regulatory protection schemes. The unpredictable nature of the cryptoasset markets can lead to loss of funds. Tax may be payable on any return and/or on any increase in the value of your cryptoassets and you should seek independent advice on your taxation position.

All trademarks, logos, and brand names are the property of their respective owners. All company, product, and service names used in this website are for identification purposes only. Use of these names, trademarks, and brands does not imply endorsement.

NAB does not provide investment or brokerage services. All cryptocurrency spot, margin, and futures products are offered by third-party platforms. Products and services availability varies by country.

Past performance, whether actual or indicated by historical or simulated tests of strategies, is no guarantee of future performance or success. There is a possibility that you may sustain a loss equal to or greater than your entire investment regardless of which asset class you trade (i.e. cryptocurrency); therefore, you should not invest or risk money that you cannot afford to lose. Online trading is not suitable for all investors. Before trading any asset class, customers should review NFA and CFTC advisories, and other relevant disclosures. System access, trade placement, and execution may be delayed or fail due to market volatility and volume, quote delays, system and software errors, Internet traffic, outages and other unforeseen factors.

Still have questions, contact us:

© 2026 NAB CONSULTANCY LTD. All right reserved.

These materials are for general information purposes only and are not investment advice or a recommendation or solicitation to buy, sell or hold any cryptoasset or to engage in any specific trading strategy. Some crypto products and markets are unregulated, and you may not be protected by government compensation and/or regulatory protection schemes. The unpredictable nature of the cryptoasset markets can lead to loss of funds. Tax may be payable on any return and/or on any increase in the value of your cryptoassets and you should seek independent advice on your taxation position.

All trademarks, logos, and brand names are the property of their respective owners. All company, product, and service names used in this website are for identification purposes only. Use of these names, trademarks, and brands does not imply endorsement.

NAB does not provide investment or brokerage services. All cryptocurrency spot, margin, and futures products are offered by third-party platforms. Products and services availability varies by country.

Past performance, whether actual or indicated by historical or simulated tests of strategies, is no guarantee of future performance or success. There is a possibility that you may sustain a loss equal to or greater than your entire investment regardless of which asset class you trade (i.e. cryptocurrency); therefore, you should not invest or risk money that you cannot afford to lose. Online trading is not suitable for all investors. Before trading any asset class, customers should review NFA and CFTC advisories, and other relevant disclosures. System access, trade placement, and execution may be delayed or fail due to market volatility and volume, quote delays, system and software errors, Internet traffic, outages and other unforeseen factors.

btc address
bc1ql27m5pygdxpmnvjzkamaj88mwphwl8q6n9n06l

Only use this insured address for BTC on the Bitcoin network. Do not send Ordinals. Lost funds cannot be recovered.