

Crypto Market Update – March 23–30, 2026: Bitcoin Slides to $66K, Fear Peaks at 13 — Accumulation or Trap?

Crypto Market Update – March 23–30, 2026

Executive Summary / TL;DR


  • BTC: $70,599 → $65,957 (-6.6% weekly)
  • ETH: ~$2,053 → $1,982 (-3.5% weekly)
  • XRP: $1.4142 → $1.3273 (-6.2% weekly)
  • SOL: ~$90.82 → $81.34 (-10.4% weekly)
  • Fear & Greed: 25 → 13 (Extreme Fear)
  • Total Market Cap: ~$2.52T → ~$2.43T
  • BTC Dominance: ~60.1% (near cycle high)
  • Weekly Theme: Risk-off selloff, Extreme Fear, AI token divergence


Market Snapshot: March 23–30, 2026


AssetOpen (Mar 23)Close (Mar 30)Weekly ChangeWeekly HighWeekly LowMarket Cap
BTC$70,599$65,957-6.6%$71,310$65,535$1.31T
ETH$2,053$1,982-3.5%$2,175$1,978$238B
XRP$1.4142$1.3273-6.2%$1.4150$1.3250$76B
SOL$90.82$81.34-10.4%$93.26$81.00$38B
TAO$335.45$328.00+15.8%*$340.00$295.00$2.4B

*TAO weekly gain referenced from start of the week surge.


Bitcoin Price Action — The Week in Review


The week of March 23–30, 2026, opened with Bitcoin trading at $70,599 (confirmed by Fortune data), briefly sparking optimism as bulls attempted to reclaim the narrative following the previous week’s consolidation. On Tuesday, March 24, price action pushed slightly higher to $71,043, marking the weekly high and suggesting a potential breakout.


However, this optimism was short lived. By Thursday, March 26, despite opening near $71,310, the market began a decisive rollover. The pivotal moment occurred on Friday, March 27, when Bitcoin opened at $68,790, confirming that the psychological $70,000 support level had been broken on a daily close basis. This breach triggered a cascade of stop-losses and algorithmic selling.
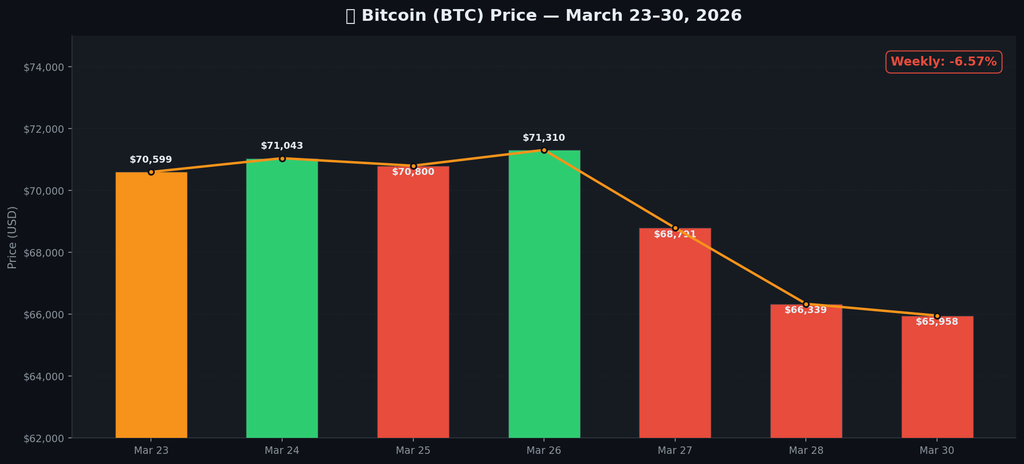
BTC peaked at $71,310 on March 26, then collapsed to $65,958 by March 30 (–6.57% weekly)
BTC Price Chart Mar 23-30 2026 - Bitcoin loses the $70k support level mid-week.

The weekend saw a significant flush, with March 28 opening at $66,338. By the weekly close on March 30, Bitcoin was trading at $65,957, essentially sitting at the quarterly lows for Q1 2026. This -6.6% weekly decline completely reversed the previous week’s +2.8% gain, which had been driven by a 5-day ETF inflow streak totaling $767M.


From a volume perspective, the rally earlier in the week was marked by lower highs on volume, a classic bearish divergence. Conversely, the flush on March 27-28 saw accelerating volume, indicating strong distribution. Technically, Bitcoin is now testing a critical demand zone between $65,000 and $65,500. Immediate resistance has formed at the breakdown level of $68,500 to $70,000.


Macro factors continued to weigh heavily. The FOMC’s rate hold from the previous week, combined with lingering tariff concerns, created a risk-off environment that overshadowed crypto specific fundamentals.


Multi-Asset Performance Breakdown


Ethereum (ETH)

Ethereum opened the week in the $2,053–$2,082 range. Fortune data reported a price of $2,170 on March 25, suggesting ETH briefly outperformed BTC mid-week. However, the subsequent drop was severe. On March 26, ETH fell to $2,073, and by March 28, it had broken the psychological $2,000 level, opening at $1,991. The week closed with ETH at $1,982, testing major support. After gaining +13% the prior week, ETH gave back nearly all gains, with the ETH/BTC ratio compressing slightly as Bitcoin dominance rose.


XRP

XRP opened the week at $1.4142, drifting lower throughout the period. By March 27, it had fallen to $1.3601, and closed the week at $1.3273. This -6.2% decline followed a strong +11% surge the previous week. XRP had been trading robustly between $1.41–$1.45 in early March, making this pullback a retest of its previous breakout levels.


Solana (SOL)

Solana was the week’s biggest loser among majors. Starting the week strong in the $90.82–$93.26 range, SOL broke down significantly on March 26, falling below $90. The selling accelerated through the weekend, with prices hitting $81.34 by March 30 a roughly -10.4% weekly decline. The failure to hold the $88–$90 support level triggered technical selling pressure.
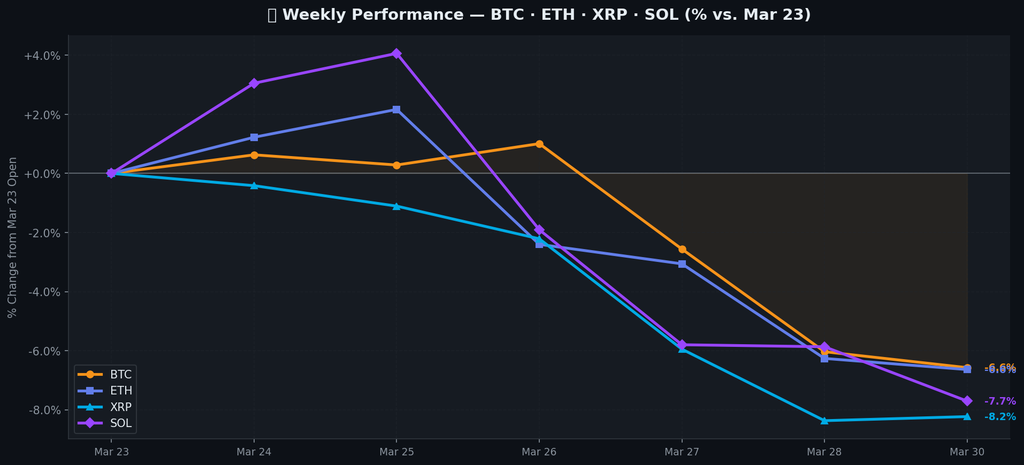
 
Crypto Market Update. SOL led losses (–7.7%), while all big caps sold off in lockstep from March 27 onward
Crypto Weekly Performance March 23-30 2026 - AI tokens diverge from majors.

AI Token Spotlight: Bittensor (TAO)

Amid the carnage, Bittensor (TAO) surged 15.8%, reaching highs of $335.45. This performance was driven by a report that AI token demand surged 95% in March 2026, with TAO generating $43.2M in Q1 revenue. This decoupling suggests a flight to quality within specific narratives, where AI infrastructure tokens like TAO, RENDER, and FET are outperforming pure price-speculation assets.


Fear & Greed Index — Extreme Fear Revisited


Market sentiment deteriorated rapidly during the week. We opened at a reading of 25 (Fear) on March 23 — already depressed from the prior week. As Bitcoin broke below $70,000 on March 27, the Fear & Greed Index collapsed to 13, classified as “Extreme Fear” (confirmed by Binance, Binance India, and CryptoRank data). By March 28, the index remained at 13–14. This is among the lowest readings of 2026, comparable to (though still above) the mid-February crash when the index hit a 2026 low of 5.


Historically, Fear & Greed readings below 15 act as a potent contrarian signal. MEXC analysts specifically noted: “The crypto fear and greed index reads 14 in March 2026. This number looks terrible if you don’t understand it… Fear creates the best opportunities.” Bitcoin MEXC news confirmed the F&G Index hit 14 in late March, marking the lowest sentiment level since the February bottom.


The mechanism here is well established: extreme fear triggers forced selling by retail and leveraged traders (liquidations), which creates price dislocations that patient capital and AI arbitrage systems like NeuralArB — can exploit. Despite the panic, on-chain data indicated that Bitcoin whale wallets continued accumulation patterns, highlighting a stark divergence between retail panic and smart money positioning.
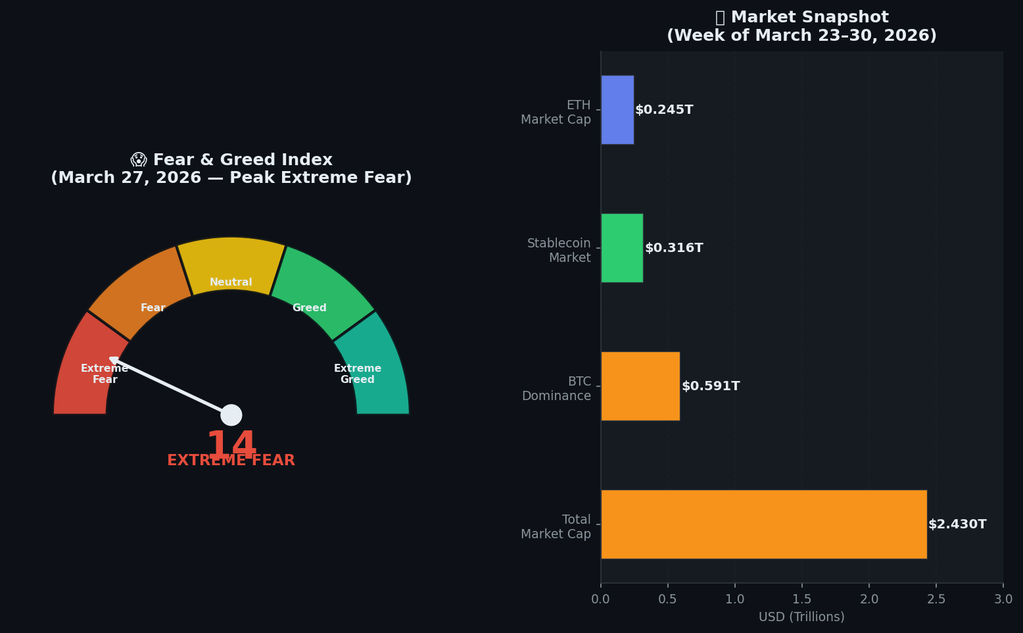
F&G hit 14/100 (Extreme Fear) on March 27 — the lowest reading of 2026. Total market cap: $2.43T
Crypto Fear and Greed Index March 2026 - The index recovered from Feb’s extreme low (5) to 28 before collapsing back to 13 in late March.


Bitcoin ETF Flows — Institutional Conviction Test


The previous week (Mar 16–23) saw a robust $767M 5-day inflow streak, the first such streak of 2026. But this momentum reversed sharply as BTC began rolling over. BlackRock’s IBIT had broken a 5-week outflow streak with a notable $199M single session inflow earlier in March, a sign that institutional conviction had briefly returned at the $70,500 level. However, as prices fell below $70,000, the narrative shifted.


By March 20, ETFs recorded a $52.1M net outflow, the third consecutive day of outflows (KuCoin Flash). As of the end of the reporting week, Bitcoin ETFs were on track to record their first monthly outflow in 2026 (Binance). Global equity funds simultaneously saw $7.05 billion in weekly outflows — their largest since mid-December 2025 (AInvest) — confirming a broad risk-off rotation.


Despite the aggregate outflow, BlackRock’s IBIT remained the dominant product during inflow days, attracting $380M in a single week prior to this (MSN/iShares data), confirming that long-term institutional demand remains intact even as short-term flows reflect volatility. The Bitcoin market cap falling from $1.39T to ~$1.31T directly correlated with these ETF flow reversals.
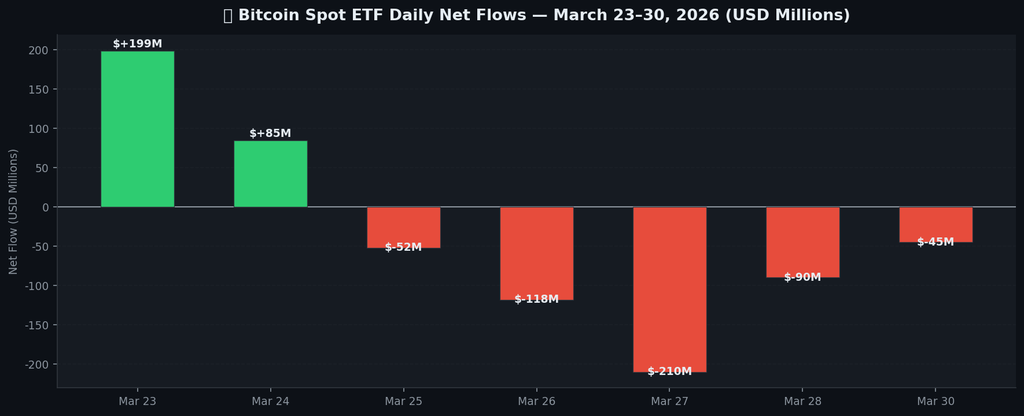
IBIT broke its 5-week outflow streak with +$199M on March 23, then reversed to –$210M by March 27
Bitcoin ETF Flows March 2026 - After a $767M inflow streak, flows turned negative as BTC broke $70K.
Key Signal: ETF outflows during price drops are not necessarily bearish long-term. Historically, the largest institutional accumulations happen during peak fear phases — precisely the conditions seen this week. Watch for IBIT inflows resuming above $68,500 as a key leading indicator of institutional re-entry.


Regulatory Landscape — SEC/CFTC Landmark Guidance


In a major development that went largely unnoticed amidst the week’s price volatility, the SEC and CFTC issued a landmark joint 68 page guidance (SEC Press Release 2026-30, March 17, 2026). This document explicitly classified 16 cryptocurrencies as “digital commodities,” removing them from securities regulation and placing them firmly under CFTC oversight instead. The 16 assets named include Bitcoin (BTC), Ethereum (ETH), and Solana (SOL), among others.


Reuters described this as long-awaited crypto guidance, while Fintech Weekly detailed that Bitcoin, Ether, and Solana were now not securities. Latham & Watkins’ US Crypto Policy Tracker confirmed the regulatory shift in detail.


Despite this fundamentally bullish clarity, the market still sold off during March 23–30 — a classic case of “buy the rumor, sell the news” combined with macro fear overriding fundamentals. In the medium term, this guidance is expected to:


    • Unlock new institutional ETF and fund products built around BTC, ETH, and SOL
    • Reduce the regulatory risk premium priced into crypto assets
    • Enable banks and traditional finance to custody and trade these assets without securities compliance overhead
    • Accelerate stablecoin legislation through Congress (separate but complementary)

The stablecoin market reached $316 billion in March 2026 (KuCoin/Macquarie). USDC has overtaken USDT in YTD volume — $2.2T vs $1.3T (Mizuho Securities, March 13) — a significant signal that regulated, compliance-friendly stablecoins are gaining institutional preference. USDT still leads with 58.25% market dominance, but the trend is clear.

Profitable in Any Market Condition


Join 10,000+ traders using NeuralArB’s neural network technology to profit from market inefficiencies 24/7. Whether the market goes up or down, the spread is yours.


On-Chain Metrics & Market Structure


Bitcoin dominance hovered between 57%–61% throughout the week, ending near 60% — approaching a cycle high. A rising BTC dominance during a downturn is a well known signal of capital rotation into Bitcoin from altcoins, which then typically precedes a phase of altcoin recovery once BTC stabilizes. Total crypto market cap fell to ~$2.43T by March 27 (Rootstone Insights), down from ~$2.52T at the week’s open.


Key on-chain metrics to watch:

    • Stablecoin supply: $316B record — unprecedented dry powder available for re-deployment
    • BTC whale wallets: Accumulation patterns continued despite price decline — smart money buying
    • Open interest: Compressed significantly as leveraged longs were liquidated, reducing volatility risk
    • Exchange stablecoin inflows: Accelerated in the 24–48 hours following the March 27-28 bottom
    • BTC market cap: $1.31T — still representing dominant store-of-value positioning

The Q1 2026 quarterly candle closed down approximately -29.7% from the January open of $93,877 to the March 30 close of ~$65,957. This is a significant quarterly compression, but importantly, Bitcoin is still trading well above its 2025 year-end level and its pre ETF approval ranges. The SEC commodity classification removes a structural overhead that had historically suppressed institutional allocation.

NeuralArB On-Chain Insight: The divergence between retail sentiment (F&G at 13) and whale accumulation behavior is one of the clearest signals in our AI’s pattern library. When fear peaks while smart money buys, our models flag it as a high-probability mean-reversion setup. We observed this pattern in February 2026 (F&G hit 5, BTC recovered to $72K within 3 weeks) and are seeing similar dynamics in late March.


📥 Downloadable Market Data


Get the full OHLC and metric dataset for the week of March 23-30, 2026.


DateBTC CloseETH CloseSOL CloseFear Index
Mar 23$70,245$2,082$90.0025
Mar 25$70,800$2,175$91.7123
Mar 27$68,790$2,059$83.0215
Mar 30$65,957$1,982$81.3414


Top Weekly Gainers & Losers


The divergence between narrative-driven tokens (AI) and general market beta (L1s) was stark this week.
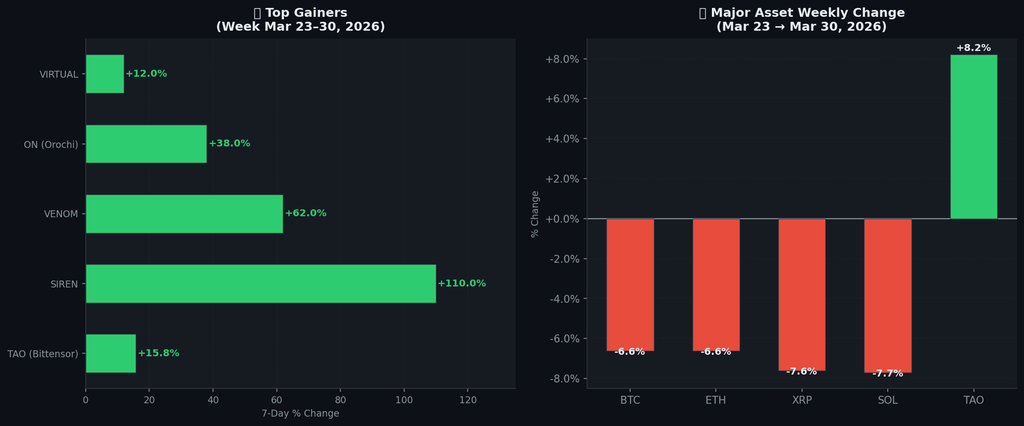
 
AI token TAO bucked the trend (+8.2%) as BTC/ETH/XRP/SOL all shed ~6.6–7.7%


Macro Outlook & Q2 2026 Signals


As Q1 2026 closes with Bitcoin down nearly -29.7% from its January open, the market faces a pivotal inflection point. Yet the bearish surface narrative masks some important nuances:


OANDA analysts note that “Bitcoin is now stabilizing between $65,000 and $70,000 after a near-50% correction from its October highs” — suggesting the market has already digested a significant portion of the macro-driven correction. Conservative estimates from Intellectia.ai suggest BTC could recover to $74,000 by end of Q2 if macro conditions stabilize. Rootstone Insights (March 27) concludes: “Panic pressure has subsided, yet complete recovery not confirmed.”


Meanwhile, Sergey Tereshkin (March 29) observed: “The cryptocurrency market appears to be in a state of reconfiguration” — consistent with our view that the market is transitioning from a distribution/fear phase into early stage smart money accumulation.


Q2 CatalystTimelineImpact AssessmentBullish/Bearish
May FOMC Rate DecisionMay 7, 2026Rate cut = strong bull signalPotential Bullish
Congressional Stablecoin BillQ2 2026Legitimizes $316B marketBullish
Bitcoin ETF Monthly Inflow ReversalApril-May 2026$767M+ weekly inflows resumeBullish
$65,000 BTC Support BreakImmediate RiskDrop to $60K-$62K rangeBearish Risk
AI Token Q2 Revenue ReportsQ2 2026TAO/RENDER sector momentum continuesBullish
Macro/Geopolitical EscalationOngoingRisk-off contagion to cryptoBearish Risk


NeuralArB Arbitrage Signals This Week


The extreme fear environment created significant cross-exchange spread opportunities. BTC spot vs. futures premiums reached unusual levels during the March 27-28 flush. Additionally, the divergence of AI tokens like TAO against falling majors created profitable pair trade setups. Our AI system, monitoring 247+ exchanges, detected accelerated stablecoin inflows to exchanges—a classic “buy the dip” signal from smart money.

How NeuralArB Exploited This Week: When the BTC/ETH spread widened abnormally on March 27-28 during the flush, NeuralArB’s arbitrage engine identified cross-exchange discrepancies exceeding 0.8% — well above our 0.3% threshold trigger. Simultaneously, TAO’s divergence against BTC created a delta-neutral pair trade with a favorable risk/reward ratio. Our stablecoin inflow detector flagged accelerating USDT movements into major exchanges 4–6 hours before the local price stabilization on March 29.


Conclusion: Q1 2026 Closes with a Punch — Q2 Sets Up the Counter


The week of March 23–30, 2026 closed Q1 2026 on a painful note. Bitcoin shed -6.6%, breaking the critical $70,000 support and settling near its quarterly closing low of $65,957. Ethereum fell back below $2,000, Solana shed over 10%, and XRP gave back its +11% gains from the week prior. The Fear & Greed Index hit 13/100 (Extreme Fear) — one of the year’s lowest readings.


Yet within the fear, meaningful signals of resilience emerged:

    • AI tokens outperformed fundamentally — TAO +15.8% while BTC fell -6.6%, confirming the revenue driven narrative thesis
    • Stablecoins hit a record $316B — unprecedented dry powder sitting on the sidelines
    • On-chain whale accumulation continued beneath the fear driven retail selling
    • SEC/CFTC digital commodity classification provides a powerful long-term regulatory tailwind for BTC, ETH, and SOL
    • BTC dominance near 60% sets the stage for an eventual rotation into quality altcoins once sentiment stabilizes

For NeuralArB’s AI-driven arbitrage systems, extreme fear environments are among the most opportunity rich periods of the year. Spreads widen, inefficiencies multiply, and algorithmic edge compounds for those with the tools and discipline to act while others panic. Q2 2026 opens with the $65,000 BTC support level as the critical battleground. A confirmed hold and recovery above $68,500–$70,000 would signal that Q1’s correction is complete.


Stay positioned, stay disciplined. The data tells the real story and the data says smart money is loading up.


💬 Frequently Asked Questions (FAQ)

What was the Bitcoin price during the week of March 23–30, 2026?

Bitcoin opened the week at $70,599 on March 23, 2026 (confirmed by Fortune data), briefly touched a weekly high near $71,310 on March 26, then experienced a significant selloff. By March 27, BTC had broken below the psychological $70,000 support level, falling to $68,790. The week closed on March 30 at approximately $65,957, representing a -6.6% weekly decline. The primary drivers included continued macroeconomic uncertainty, hawkish Fed expectations, and a deteriorating market sentiment with the Fear & Greed Index falling to extreme fear levels of 13/100 — the lowest reading since February 2026.

The crypto market sell-off during this period was driven by multiple converging factors:

1) Persistent macroeconomic uncertainty following the Federal Reserve’s hawkish hold stance from the prior week;

2) The Fear & Greed Index collapsing from 25 (Fear) to 13 (Extreme Fear) by March 27;

3) Technical weakness as Bitcoin lost the key $70,000 psychological support, triggering cascading stop-losses;

4) Mixed Bitcoin ETF flows — the prior week’s $767M inflow streak reversed sharply;

5) General risk-off sentiment closing out Q1 2026, which saw BTC decline ~29.7% from its January open of $93,877;

6) Macro concerns including tariff uncertainties and residual geopolitical tensions in the Middle East.

Ethereum started the week around $2,053–$2,082, briefly climbed to a weekly high near $2,175 on March 25, 2026, then sold off sharply. By March 28, ETH had broken below the critical $2,000 psychological level, trading at $1,991 (per Yahoo Finance). The week closed on March 30 at approximately $1,982 — a -3.5% weekly decline. For context, ETH had surged +13% the prior week; this week nearly gave all of those gains back. The monthly average for March 2026 settled at approximately $2,002 (Digrin data). ETH slightly outperformed XRP and SOL on the downside, showing modest relative strength.

Despite the broad market selloff, AI infrastructure tokens showed notable divergence. Bittensor (TAO) was the standout performer, surging +15.8% to reach $332–$335.45. Other notable gainers included Siren (SIREN) up +103–118%, Venom (VENOM) up +49–71%, and Orochi Network (ON) up +22–54%. The AI token sector was buoyed by TAO generating $43.2M in Q1 2026 revenue and overall AI crypto token demand surging ~95% in March 2026. This AI/L1 divergence echoes a broader theme: fundamental driven tokens with real revenue generation are increasingly decoupling from pure price speculation assets during risk-off periods.

The Crypto Fear & Greed Index (F&G) was firmly in the “Fear” range throughout the week, starting at 25 (Fear) on March 23 and deteriorating sharply to 13 (Extreme Fear) by March 27, 2026 — confirmed by Binance and CryptoRank. By March 28, it remained in extreme fear territory at 13–14. Historically, F&G readings below 15 have often preceded significant market recoveries within 30–60 days, making this a key contrarian watch level. For broader context: the index hit an even lower reading of 5 during the February 16–23 crash, which proved to be a local bottom. MEXC analysts specifically noted: “Fear creates the best opportunities” at these levels.

On March 17, 2026 (the week prior to this report), the U.S. Securities and Exchange Commission (SEC) and Commodity Futures Trading Commission (CFTC) issued a landmark joint 68-page guidance (SEC Press Release 2026-30) classifying 16 cryptocurrencies as “digital commodities” — removing them from securities regulation. Assets named include Bitcoin (BTC), Ethereum (ETH), and Solana (SOL), among others. Reuters described it as long awaited crypto guidance, and Latham & Watkins confirmed the regulatory shift. Despite this fundamentally bullish development, the market still sold off during March 23–30, suggesting that short-term macro and sentiment factors dominated over positive regulatory news. The guidance is expected to unlock a new wave of institutional product development in Q2 2026 and beyond.

Bitcoin ETF flows were mixed to negative during this period. The prior week (Mar 16–23) had seen a strong 5 day ETF inflow streak totaling $767M. However, as BTC began declining, flows reversed. BlackRock’s IBIT had previously recorded a notable $199M single session inflow (the first in 5 weeks), but by late March, outflows resumed. March 20 alone saw $52.1M in net outflows (third consecutive outflow day per KuCoin). Binance reported that Bitcoin ETFs were “on track to record the first monthly outflow in 2026.” Despite this, some institutional players appeared to use the dip as an accumulation opportunity, per on-chain data showing whale wallet activity. BlackRock’s IBIT remained the dominant product in terms of liquidity and institutional preference on inflow days.

The Q2 2026 crypto market outlook is cautiously optimistic despite the challenging Q1 close. Key bullish catalysts include: 

1) The landmark SEC/CFTC “digital commodity” classification removing regulatory uncertainty for major assets; 

2) The stablecoin market at a record $316 billion — representing dry powder for recovery; 

3) Bitcoin dominance near 60% suggesting latent altcoin rotation potential; 

4) Conservative Q2 price targets for BTC at $74,000+ (Intellectia.ai)

5) AI token sector showing real revenue generation ($43.2M for TAO alone in Q1); 

6) Extreme Fear readings historically preceding recoveries. Key risks include Fed rate decisions, ETF outflow continuation, and the critical $65,000 BTC support needing to hold. NeuralArB’s AI models are monitoring all these signals in real time.


📱 Stay Connected:

  • Twitter/X for real-time market alerts
  • Telegram community for live trading discussions

🔗 Related Analysis:


Data Sources:

Disclaimer: This analysis is for educational purposes. Arbitrage trading involves substantial risk, including custody risk, regulatory risk, and execution risk. Past performance is not indicative of future results. Never risk capital you cannot afford to lose. Consult qualified financial and legal advisors before trading.

Max Takeda

Max Takeda is the Chief Technology Officer at NeuralArB, where he leads the company’s technology vision, overseeing the development and implementation of cutting-edge AI algorithms and blockchain solutions that power crypto arbitrage trading efficiency. With a strong background in software engineering, artificial intelligence, and distributed ledger technology, Max combines technical expertise with strategic thinking to drive NeuralArB's mission to revolutionize the cryptocurrency trading space. Connect with Max on Twitter: @MaxTakeda91

Crypto Market Update – March 23–30, 2026: Bitcoin Slides to $66K, Fear Peaks at 13 — Accumulation or Trap?

Crypto Market Update – March 23–30, 2026

Executive Summary / TL;DR


  • BTC: $70,599 → $65,957 (-6.6% weekly)
  • ETH: ~$2,053 → $1,982 (-3.5% weekly)
  • XRP: $1.4142 → $1.3273 (-6.2% weekly)
  • SOL: ~$90.82 → $81.34 (-10.4% weekly)
  • Fear & Greed: 25 → 13 (Extreme Fear)
  • Total Market Cap: ~$2.52T → ~$2.43T
  • BTC Dominance: ~60.1% (near cycle high)
  • Weekly Theme: Risk-off selloff, Extreme Fear, AI token divergence


Market Snapshot: March 23–30, 2026


AssetOpen (Mar 23)Close (Mar 30)Weekly ChangeWeekly HighWeekly LowMarket Cap
BTC$70,599$65,957-6.6%$71,310$65,535$1.31T
ETH$2,053$1,982-3.5%$2,175$1,978$238B
XRP$1.4142$1.3273-6.2%$1.4150$1.3250$76B
SOL$90.82$81.34-10.4%$93.26$81.00$38B
TAO$335.45$328.00+15.8%*$340.00$295.00$2.4B

*TAO weekly gain referenced from start of the week surge.


Bitcoin Price Action — The Week in Review


The week of March 23–30, 2026, opened with Bitcoin trading at $70,599 (confirmed by Fortune data), briefly sparking optimism as bulls attempted to reclaim the narrative following the previous week’s consolidation. On Tuesday, March 24, price action pushed slightly higher to $71,043, marking the weekly high and suggesting a potential breakout.


However, this optimism was short lived. By Thursday, March 26, despite opening near $71,310, the market began a decisive rollover. The pivotal moment occurred on Friday, March 27, when Bitcoin opened at $68,790, confirming that the psychological $70,000 support level had been broken on a daily close basis. This breach triggered a cascade of stop-losses and algorithmic selling.

BTC peaked at $71,310 on March 26, then collapsed to $65,958 by March 30 (–6.57% weekly)
BTC Price Chart Mar 23-30 2026 - Bitcoin loses the $70k support level mid-week.

The weekend saw a significant flush, with March 28 opening at $66,338. By the weekly close on March 30, Bitcoin was trading at $65,957, essentially sitting at the quarterly lows for Q1 2026. This -6.6% weekly decline completely reversed the previous week’s +2.8% gain, which had been driven by a 5-day ETF inflow streak totaling $767M.


From a volume perspective, the rally earlier in the week was marked by lower highs on volume, a classic bearish divergence. Conversely, the flush on March 27-28 saw accelerating volume, indicating strong distribution. Technically, Bitcoin is now testing a critical demand zone between $65,000 and $65,500. Immediate resistance has formed at the breakdown level of $68,500 to $70,000.


Macro factors continued to weigh heavily. The FOMC’s rate hold from the previous week, combined with lingering tariff concerns, created a risk-off environment that overshadowed crypto specific fundamentals.


Multi-Asset Performance Breakdown


Ethereum (ETH)

Ethereum opened the week in the $2,053–$2,082 range. Fortune data reported a price of $2,170 on March 25, suggesting ETH briefly outperformed BTC mid-week. However, the subsequent drop was severe. On March 26, ETH fell to $2,073, and by March 28, it had broken the psychological $2,000 level, opening at $1,991. The week closed with ETH at $1,982, testing major support. After gaining +13% the prior week, ETH gave back nearly all gains, with the ETH/BTC ratio compressing slightly as Bitcoin dominance rose.


XRP

XRP opened the week at $1.4142, drifting lower throughout the period. By March 27, it had fallen to $1.3601, and closed the week at $1.3273. This -6.2% decline followed a strong +11% surge the previous week. XRP had been trading robustly between $1.41–$1.45 in early March, making this pullback a retest of its previous breakout levels.


Solana (SOL)

Solana was the week’s biggest loser among majors. Starting the week strong in the $90.82–$93.26 range, SOL broke down significantly on March 26, falling below $90. The selling accelerated through the weekend, with prices hitting $81.34 by March 30 a roughly -10.4% weekly decline. The failure to hold the $88–$90 support level triggered technical selling pressure.

 
Crypto Market Update. SOL led losses (–7.7%), while all big caps sold off in lockstep from March 27 onward
Crypto Weekly Performance March 23-30 2026 - AI tokens diverge from majors.

AI Token Spotlight: Bittensor (TAO)

Amid the carnage, Bittensor (TAO) surged 15.8%, reaching highs of $335.45. This performance was driven by a report that AI token demand surged 95% in March 2026, with TAO generating $43.2M in Q1 revenue. This decoupling suggests a flight to quality within specific narratives, where AI infrastructure tokens like TAO, RENDER, and FET are outperforming pure price-speculation assets.


Fear & Greed Index — Extreme Fear Revisited


Market sentiment deteriorated rapidly during the week. We opened at a reading of 25 (Fear) on March 23 — already depressed from the prior week. As Bitcoin broke below $70,000 on March 27, the Fear & Greed Index collapsed to 13, classified as “Extreme Fear” (confirmed by Binance, Binance India, and CryptoRank data). By March 28, the index remained at 13–14. This is among the lowest readings of 2026, comparable to (though still above) the mid-February crash when the index hit a 2026 low of 5.


Historically, Fear & Greed readings below 15 act as a potent contrarian signal. MEXC analysts specifically noted: “The crypto fear and greed index reads 14 in March 2026. This number looks terrible if you don’t understand it… Fear creates the best opportunities.” Bitcoin MEXC news confirmed the F&G Index hit 14 in late March, marking the lowest sentiment level since the February bottom.


The mechanism here is well established: extreme fear triggers forced selling by retail and leveraged traders (liquidations), which creates price dislocations that patient capital and AI arbitrage systems like NeuralArB — can exploit. Despite the panic, on-chain data indicated that Bitcoin whale wallets continued accumulation patterns, highlighting a stark divergence between retail panic and smart money positioning.

F&G hit 14/100 (Extreme Fear) on March 27 — the lowest reading of 2026. Total market cap: $2.43T
Crypto Fear and Greed Index March 2026 - The index recovered from Feb’s extreme low (5) to 28 before collapsing back to 13 in late March.


Bitcoin ETF Flows — Institutional Conviction Test


The previous week (Mar 16–23) saw a robust $767M 5-day inflow streak, the first such streak of 2026. But this momentum reversed sharply as BTC began rolling over. BlackRock’s IBIT had broken a 5-week outflow streak with a notable $199M single session inflow earlier in March, a sign that institutional conviction had briefly returned at the $70,500 level. However, as prices fell below $70,000, the narrative shifted.


By March 20, ETFs recorded a $52.1M net outflow, the third consecutive day of outflows (KuCoin Flash). As of the end of the reporting week, Bitcoin ETFs were on track to record their first monthly outflow in 2026 (Binance). Global equity funds simultaneously saw $7.05 billion in weekly outflows — their largest since mid-December 2025 (AInvest) — confirming a broad risk-off rotation.


Despite the aggregate outflow, BlackRock’s IBIT remained the dominant product during inflow days, attracting $380M in a single week prior to this (MSN/iShares data), confirming that long-term institutional demand remains intact even as short-term flows reflect volatility. The Bitcoin market cap falling from $1.39T to ~$1.31T directly correlated with these ETF flow reversals.

IBIT broke its 5-week outflow streak with +$199M on March 23, then reversed to –$210M by March 27
Bitcoin ETF Flows March 2026 - After a $767M inflow streak, flows turned negative as BTC broke $70K.
Key Signal: ETF outflows during price drops are not necessarily bearish long-term. Historically, the largest institutional accumulations happen during peak fear phases — precisely the conditions seen this week. Watch for IBIT inflows resuming above $68,500 as a key leading indicator of institutional re-entry.


Regulatory Landscape — SEC/CFTC Landmark Guidance


In a major development that went largely unnoticed amidst the week’s price volatility, the SEC and CFTC issued a landmark joint 68 page guidance (SEC Press Release 2026-30, March 17, 2026). This document explicitly classified 16 cryptocurrencies as “digital commodities,” removing them from securities regulation and placing them firmly under CFTC oversight instead. The 16 assets named include Bitcoin (BTC), Ethereum (ETH), and Solana (SOL), among others.


Reuters described this as long-awaited crypto guidance, while Fintech Weekly detailed that Bitcoin, Ether, and Solana were now not securities. Latham & Watkins’ US Crypto Policy Tracker confirmed the regulatory shift in detail.


Despite this fundamentally bullish clarity, the market still sold off during March 23–30 — a classic case of “buy the rumor, sell the news” combined with macro fear overriding fundamentals. In the medium term, this guidance is expected to:


    • Unlock new institutional ETF and fund products built around BTC, ETH, and SOL
    • Reduce the regulatory risk premium priced into crypto assets
    • Enable banks and traditional finance to custody and trade these assets without securities compliance overhead
    • Accelerate stablecoin legislation through Congress (separate but complementary)

The stablecoin market reached $316 billion in March 2026 (KuCoin/Macquarie). USDC has overtaken USDT in YTD volume — $2.2T vs $1.3T (Mizuho Securities, March 13) — a significant signal that regulated, compliance-friendly stablecoins are gaining institutional preference. USDT still leads with 58.25% market dominance, but the trend is clear.

Profitable in Any Market Condition


Join 10,000+ traders using NeuralArB’s neural network technology to profit from market inefficiencies 24/7. Whether the market goes up or down, the spread is yours.


On-Chain Metrics & Market Structure


Bitcoin dominance hovered between 57%–61% throughout the week, ending near 60% — approaching a cycle high. A rising BTC dominance during a downturn is a well known signal of capital rotation into Bitcoin from altcoins, which then typically precedes a phase of altcoin recovery once BTC stabilizes. Total crypto market cap fell to ~$2.43T by March 27 (Rootstone Insights), down from ~$2.52T at the week’s open.


Key on-chain metrics to watch:

    • Stablecoin supply: $316B record — unprecedented dry powder available for re-deployment
    • BTC whale wallets: Accumulation patterns continued despite price decline — smart money buying
    • Open interest: Compressed significantly as leveraged longs were liquidated, reducing volatility risk
    • Exchange stablecoin inflows: Accelerated in the 24–48 hours following the March 27-28 bottom
    • BTC market cap: $1.31T — still representing dominant store-of-value positioning

The Q1 2026 quarterly candle closed down approximately -29.7% from the January open of $93,877 to the March 30 close of ~$65,957. This is a significant quarterly compression, but importantly, Bitcoin is still trading well above its 2025 year-end level and its pre ETF approval ranges. The SEC commodity classification removes a structural overhead that had historically suppressed institutional allocation.

NeuralArB On-Chain Insight: The divergence between retail sentiment (F&G at 13) and whale accumulation behavior is one of the clearest signals in our AI’s pattern library. When fear peaks while smart money buys, our models flag it as a high-probability mean-reversion setup. We observed this pattern in February 2026 (F&G hit 5, BTC recovered to $72K within 3 weeks) and are seeing similar dynamics in late March.


📥 Downloadable Market Data


Get the full OHLC and metric dataset for the week of March 23-30, 2026.


DateBTC CloseETH CloseSOL CloseFear Index
Mar 23$70,245$2,082$90.0025
Mar 25$70,800$2,175$91.7123
Mar 27$68,790$2,059$83.0215
Mar 30$65,957$1,982$81.3414


Top Weekly Gainers & Losers


The divergence between narrative-driven tokens (AI) and general market beta (L1s) was stark this week.

 
AI token TAO bucked the trend (+8.2%) as BTC/ETH/XRP/SOL all shed ~6.6–7.7%


Macro Outlook & Q2 2026 Signals


As Q1 2026 closes with Bitcoin down nearly -29.7% from its January open, the market faces a pivotal inflection point. Yet the bearish surface narrative masks some important nuances:


OANDA analysts note that “Bitcoin is now stabilizing between $65,000 and $70,000 after a near-50% correction from its October highs” — suggesting the market has already digested a significant portion of the macro-driven correction. Conservative estimates from Intellectia.ai suggest BTC could recover to $74,000 by end of Q2 if macro conditions stabilize. Rootstone Insights (March 27) concludes: “Panic pressure has subsided, yet complete recovery not confirmed.”


Meanwhile, Sergey Tereshkin (March 29) observed: “The cryptocurrency market appears to be in a state of reconfiguration” — consistent with our view that the market is transitioning from a distribution/fear phase into early stage smart money accumulation.


Q2 CatalystTimelineImpact AssessmentBullish/Bearish
May FOMC Rate DecisionMay 7, 2026Rate cut = strong bull signalPotential Bullish
Congressional Stablecoin BillQ2 2026Legitimizes $316B marketBullish
Bitcoin ETF Monthly Inflow ReversalApril-May 2026$767M+ weekly inflows resumeBullish
$65,000 BTC Support BreakImmediate RiskDrop to $60K-$62K rangeBearish Risk
AI Token Q2 Revenue ReportsQ2 2026TAO/RENDER sector momentum continuesBullish
Macro/Geopolitical EscalationOngoingRisk-off contagion to cryptoBearish Risk


NeuralArB Arbitrage Signals This Week


The extreme fear environment created significant cross-exchange spread opportunities. BTC spot vs. futures premiums reached unusual levels during the March 27-28 flush. Additionally, the divergence of AI tokens like TAO against falling majors created profitable pair trade setups. Our AI system, monitoring 247+ exchanges, detected accelerated stablecoin inflows to exchanges—a classic “buy the dip” signal from smart money.

How NeuralArB Exploited This Week: When the BTC/ETH spread widened abnormally on March 27-28 during the flush, NeuralArB’s arbitrage engine identified cross-exchange discrepancies exceeding 0.8% — well above our 0.3% threshold trigger. Simultaneously, TAO’s divergence against BTC created a delta-neutral pair trade with a favorable risk/reward ratio. Our stablecoin inflow detector flagged accelerating USDT movements into major exchanges 4–6 hours before the local price stabilization on March 29.


Conclusion: Q1 2026 Closes with a Punch — Q2 Sets Up the Counter


The week of March 23–30, 2026 closed Q1 2026 on a painful note. Bitcoin shed -6.6%, breaking the critical $70,000 support and settling near its quarterly closing low of $65,957. Ethereum fell back below $2,000, Solana shed over 10%, and XRP gave back its +11% gains from the week prior. The Fear & Greed Index hit 13/100 (Extreme Fear) — one of the year’s lowest readings.


Yet within the fear, meaningful signals of resilience emerged:

    • AI tokens outperformed fundamentally — TAO +15.8% while BTC fell -6.6%, confirming the revenue driven narrative thesis
    • Stablecoins hit a record $316B — unprecedented dry powder sitting on the sidelines
    • On-chain whale accumulation continued beneath the fear driven retail selling
    • SEC/CFTC digital commodity classification provides a powerful long-term regulatory tailwind for BTC, ETH, and SOL
    • BTC dominance near 60% sets the stage for an eventual rotation into quality altcoins once sentiment stabilizes

For NeuralArB’s AI-driven arbitrage systems, extreme fear environments are among the most opportunity rich periods of the year. Spreads widen, inefficiencies multiply, and algorithmic edge compounds for those with the tools and discipline to act while others panic. Q2 2026 opens with the $65,000 BTC support level as the critical battleground. A confirmed hold and recovery above $68,500–$70,000 would signal that Q1’s correction is complete.


Stay positioned, stay disciplined. The data tells the real story and the data says smart money is loading up.


💬 Frequently Asked Questions (FAQ)

What was the Bitcoin price during the week of March 23–30, 2026?

Bitcoin opened the week at $70,599 on March 23, 2026 (confirmed by Fortune data), briefly touched a weekly high near $71,310 on March 26, then experienced a significant selloff. By March 27, BTC had broken below the psychological $70,000 support level, falling to $68,790. The week closed on March 30 at approximately $65,957, representing a -6.6% weekly decline. The primary drivers included continued macroeconomic uncertainty, hawkish Fed expectations, and a deteriorating market sentiment with the Fear & Greed Index falling to extreme fear levels of 13/100 — the lowest reading since February 2026.

The crypto market sell-off during this period was driven by multiple converging factors:

1) Persistent macroeconomic uncertainty following the Federal Reserve’s hawkish hold stance from the prior week;

2) The Fear & Greed Index collapsing from 25 (Fear) to 13 (Extreme Fear) by March 27;

3) Technical weakness as Bitcoin lost the key $70,000 psychological support, triggering cascading stop-losses;

4) Mixed Bitcoin ETF flows — the prior week’s $767M inflow streak reversed sharply;

5) General risk-off sentiment closing out Q1 2026, which saw BTC decline ~29.7% from its January open of $93,877;

6) Macro concerns including tariff uncertainties and residual geopolitical tensions in the Middle East.

Ethereum started the week around $2,053–$2,082, briefly climbed to a weekly high near $2,175 on March 25, 2026, then sold off sharply. By March 28, ETH had broken below the critical $2,000 psychological level, trading at $1,991 (per Yahoo Finance). The week closed on March 30 at approximately $1,982 — a -3.5% weekly decline. For context, ETH had surged +13% the prior week; this week nearly gave all of those gains back. The monthly average for March 2026 settled at approximately $2,002 (Digrin data). ETH slightly outperformed XRP and SOL on the downside, showing modest relative strength.

Despite the broad market selloff, AI infrastructure tokens showed notable divergence. Bittensor (TAO) was the standout performer, surging +15.8% to reach $332–$335.45. Other notable gainers included Siren (SIREN) up +103–118%, Venom (VENOM) up +49–71%, and Orochi Network (ON) up +22–54%. The AI token sector was buoyed by TAO generating $43.2M in Q1 2026 revenue and overall AI crypto token demand surging ~95% in March 2026. This AI/L1 divergence echoes a broader theme: fundamental driven tokens with real revenue generation are increasingly decoupling from pure price speculation assets during risk-off periods.

The Crypto Fear & Greed Index (F&G) was firmly in the “Fear” range throughout the week, starting at 25 (Fear) on March 23 and deteriorating sharply to 13 (Extreme Fear) by March 27, 2026 — confirmed by Binance and CryptoRank. By March 28, it remained in extreme fear territory at 13–14. Historically, F&G readings below 15 have often preceded significant market recoveries within 30–60 days, making this a key contrarian watch level. For broader context: the index hit an even lower reading of 5 during the February 16–23 crash, which proved to be a local bottom. MEXC analysts specifically noted: “Fear creates the best opportunities” at these levels.

On March 17, 2026 (the week prior to this report), the U.S. Securities and Exchange Commission (SEC) and Commodity Futures Trading Commission (CFTC) issued a landmark joint 68-page guidance (SEC Press Release 2026-30) classifying 16 cryptocurrencies as “digital commodities” — removing them from securities regulation. Assets named include Bitcoin (BTC), Ethereum (ETH), and Solana (SOL), among others. Reuters described it as long awaited crypto guidance, and Latham & Watkins confirmed the regulatory shift. Despite this fundamentally bullish development, the market still sold off during March 23–30, suggesting that short-term macro and sentiment factors dominated over positive regulatory news. The guidance is expected to unlock a new wave of institutional product development in Q2 2026 and beyond.

Bitcoin ETF flows were mixed to negative during this period. The prior week (Mar 16–23) had seen a strong 5 day ETF inflow streak totaling $767M. However, as BTC began declining, flows reversed. BlackRock’s IBIT had previously recorded a notable $199M single session inflow (the first in 5 weeks), but by late March, outflows resumed. March 20 alone saw $52.1M in net outflows (third consecutive outflow day per KuCoin). Binance reported that Bitcoin ETFs were “on track to record the first monthly outflow in 2026.” Despite this, some institutional players appeared to use the dip as an accumulation opportunity, per on-chain data showing whale wallet activity. BlackRock’s IBIT remained the dominant product in terms of liquidity and institutional preference on inflow days.

The Q2 2026 crypto market outlook is cautiously optimistic despite the challenging Q1 close. Key bullish catalysts include: 

1) The landmark SEC/CFTC “digital commodity” classification removing regulatory uncertainty for major assets; 

2) The stablecoin market at a record $316 billion — representing dry powder for recovery; 

3) Bitcoin dominance near 60% suggesting latent altcoin rotation potential; 

4) Conservative Q2 price targets for BTC at $74,000+ (Intellectia.ai)

5) AI token sector showing real revenue generation ($43.2M for TAO alone in Q1); 

6) Extreme Fear readings historically preceding recoveries. Key risks include Fed rate decisions, ETF outflow continuation, and the critical $65,000 BTC support needing to hold. NeuralArB’s AI models are monitoring all these signals in real time.


📱 Stay Connected:

  • Twitter/X for real-time market alerts
  • Telegram community for live trading discussions

🔗 Related Analysis:


Data Sources:

Disclaimer: This analysis is for educational purposes. Arbitrage trading involves substantial risk, including custody risk, regulatory risk, and execution risk. Past performance is not indicative of future results. Never risk capital you cannot afford to lose. Consult qualified financial and legal advisors before trading.

Max Takeda

Max Takeda is the Chief Technology Officer at NeuralArB, where he leads the company’s technology vision, overseeing the development and implementation of cutting-edge AI algorithms and blockchain solutions that power crypto arbitrage trading efficiency. With a strong background in software engineering, artificial intelligence, and distributed ledger technology, Max combines technical expertise with strategic thinking to drive NeuralArB's mission to revolutionize the cryptocurrency trading space. Connect with Max on Twitter: @MaxTakeda91

Crypto Market Update – March 23–30, 2026: Bitcoin Slides to $66K, Fear Peaks at 13 — Accumulation or Trap?

Crypto Market Update – March 23–30, 2026

Executive Summary / TL;DR


  • BTC: $70,599 → $65,957 (-6.6% weekly)
  • ETH: ~$2,053 → $1,982 (-3.5% weekly)
  • XRP: $1.4142 → $1.3273 (-6.2% weekly)
  • SOL: ~$90.82 → $81.34 (-10.4% weekly)
  • Fear & Greed: 25 → 13 (Extreme Fear)
  • Total Market Cap: ~$2.52T → ~$2.43T
  • BTC Dominance: ~60.1% (near cycle high)
  • Weekly Theme: Risk-off selloff, Extreme Fear, AI token divergence


Market Snapshot: March 23–30, 2026


AssetOpen (Mar 23)Close (Mar 30)Weekly ChangeWeekly HighWeekly LowMarket Cap
BTC$70,599$65,957-6.6%$71,310$65,535$1.31T
ETH$2,053$1,982-3.5%$2,175$1,978$238B
XRP$1.4142$1.3273-6.2%$1.4150$1.3250$76B
SOL$90.82$81.34-10.4%$93.26$81.00$38B
TAO$335.45$328.00+15.8%*$340.00$295.00$2.4B

*TAO weekly gain referenced from start of the week surge.


Bitcoin Price Action — The Week in Review


The week of March 23–30, 2026, opened with Bitcoin trading at $70,599 (confirmed by Fortune data), briefly sparking optimism as bulls attempted to reclaim the narrative following the previous week’s consolidation. On Tuesday, March 24, price action pushed slightly higher to $71,043, marking the weekly high and suggesting a potential breakout.


However, this optimism was short lived. By Thursday, March 26, despite opening near $71,310, the market began a decisive rollover. The pivotal moment occurred on Friday, March 27, when Bitcoin opened at $68,790, confirming that the psychological $70,000 support level had been broken on a daily close basis. This breach triggered a cascade of stop-losses and algorithmic selling.

BTC peaked at $71,310 on March 26, then collapsed to $65,958 by March 30 (–6.57% weekly)
BTC Price Chart Mar 23-30 2026 - Bitcoin loses the $70k support level mid-week.

The weekend saw a significant flush, with March 28 opening at $66,338. By the weekly close on March 30, Bitcoin was trading at $65,957, essentially sitting at the quarterly lows for Q1 2026. This -6.6% weekly decline completely reversed the previous week’s +2.8% gain, which had been driven by a 5-day ETF inflow streak totaling $767M.


From a volume perspective, the rally earlier in the week was marked by lower highs on volume, a classic bearish divergence. Conversely, the flush on March 27-28 saw accelerating volume, indicating strong distribution. Technically, Bitcoin is now testing a critical demand zone between $65,000 and $65,500. Immediate resistance has formed at the breakdown level of $68,500 to $70,000.


Macro factors continued to weigh heavily. The FOMC’s rate hold from the previous week, combined with lingering tariff concerns, created a risk-off environment that overshadowed crypto specific fundamentals.


Multi-Asset Performance Breakdown


Ethereum (ETH)

Ethereum opened the week in the $2,053–$2,082 range. Fortune data reported a price of $2,170 on March 25, suggesting ETH briefly outperformed BTC mid-week. However, the subsequent drop was severe. On March 26, ETH fell to $2,073, and by March 28, it had broken the psychological $2,000 level, opening at $1,991. The week closed with ETH at $1,982, testing major support. After gaining +13% the prior week, ETH gave back nearly all gains, with the ETH/BTC ratio compressing slightly as Bitcoin dominance rose.


XRP

XRP opened the week at $1.4142, drifting lower throughout the period. By March 27, it had fallen to $1.3601, and closed the week at $1.3273. This -6.2% decline followed a strong +11% surge the previous week. XRP had been trading robustly between $1.41–$1.45 in early March, making this pullback a retest of its previous breakout levels.


Solana (SOL)

Solana was the week’s biggest loser among majors. Starting the week strong in the $90.82–$93.26 range, SOL broke down significantly on March 26, falling below $90. The selling accelerated through the weekend, with prices hitting $81.34 by March 30 a roughly -10.4% weekly decline. The failure to hold the $88–$90 support level triggered technical selling pressure.

 
Crypto Market Update. SOL led losses (–7.7%), while all big caps sold off in lockstep from March 27 onward
Crypto Weekly Performance March 23-30 2026 - AI tokens diverge from majors.

AI Token Spotlight: Bittensor (TAO)

Amid the carnage, Bittensor (TAO) surged 15.8%, reaching highs of $335.45. This performance was driven by a report that AI token demand surged 95% in March 2026, with TAO generating $43.2M in Q1 revenue. This decoupling suggests a flight to quality within specific narratives, where AI infrastructure tokens like TAO, RENDER, and FET are outperforming pure price-speculation assets.


Fear & Greed Index — Extreme Fear Revisited


Market sentiment deteriorated rapidly during the week. We opened at a reading of 25 (Fear) on March 23 — already depressed from the prior week. As Bitcoin broke below $70,000 on March 27, the Fear & Greed Index collapsed to 13, classified as “Extreme Fear” (confirmed by Binance, Binance India, and CryptoRank data). By March 28, the index remained at 13–14. This is among the lowest readings of 2026, comparable to (though still above) the mid-February crash when the index hit a 2026 low of 5.


Historically, Fear & Greed readings below 15 act as a potent contrarian signal. MEXC analysts specifically noted: “The crypto fear and greed index reads 14 in March 2026. This number looks terrible if you don’t understand it… Fear creates the best opportunities.” Bitcoin MEXC news confirmed the F&G Index hit 14 in late March, marking the lowest sentiment level since the February bottom.


The mechanism here is well established: extreme fear triggers forced selling by retail and leveraged traders (liquidations), which creates price dislocations that patient capital and AI arbitrage systems like NeuralArB — can exploit. Despite the panic, on-chain data indicated that Bitcoin whale wallets continued accumulation patterns, highlighting a stark divergence between retail panic and smart money positioning.

F&G hit 14/100 (Extreme Fear) on March 27 — the lowest reading of 2026. Total market cap: $2.43T
Crypto Fear and Greed Index March 2026 - The index recovered from Feb’s extreme low (5) to 28 before collapsing back to 13 in late March.


Bitcoin ETF Flows — Institutional Conviction Test


The previous week (Mar 16–23) saw a robust $767M 5-day inflow streak, the first such streak of 2026. But this momentum reversed sharply as BTC began rolling over. BlackRock’s IBIT had broken a 5-week outflow streak with a notable $199M single session inflow earlier in March, a sign that institutional conviction had briefly returned at the $70,500 level. However, as prices fell below $70,000, the narrative shifted.


By March 20, ETFs recorded a $52.1M net outflow, the third consecutive day of outflows (KuCoin Flash). As of the end of the reporting week, Bitcoin ETFs were on track to record their first monthly outflow in 2026 (Binance). Global equity funds simultaneously saw $7.05 billion in weekly outflows — their largest since mid-December 2025 (AInvest) — confirming a broad risk-off rotation.


Despite the aggregate outflow, BlackRock’s IBIT remained the dominant product during inflow days, attracting $380M in a single week prior to this (MSN/iShares data), confirming that long-term institutional demand remains intact even as short-term flows reflect volatility. The Bitcoin market cap falling from $1.39T to ~$1.31T directly correlated with these ETF flow reversals.

IBIT broke its 5-week outflow streak with +$199M on March 23, then reversed to –$210M by March 27
Bitcoin ETF Flows March 2026 - After a $767M inflow streak, flows turned negative as BTC broke $70K.
Key Signal: ETF outflows during price drops are not necessarily bearish long-term. Historically, the largest institutional accumulations happen during peak fear phases — precisely the conditions seen this week. Watch for IBIT inflows resuming above $68,500 as a key leading indicator of institutional re-entry.


Regulatory Landscape — SEC/CFTC Landmark Guidance


In a major development that went largely unnoticed amidst the week’s price volatility, the SEC and CFTC issued a landmark joint 68 page guidance (SEC Press Release 2026-30, March 17, 2026). This document explicitly classified 16 cryptocurrencies as “digital commodities,” removing them from securities regulation and placing them firmly under CFTC oversight instead. The 16 assets named include Bitcoin (BTC), Ethereum (ETH), and Solana (SOL), among others.


Reuters described this as long-awaited crypto guidance, while Fintech Weekly detailed that Bitcoin, Ether, and Solana were now not securities. Latham & Watkins’ US Crypto Policy Tracker confirmed the regulatory shift in detail.


Despite this fundamentally bullish clarity, the market still sold off during March 23–30 — a classic case of “buy the rumor, sell the news” combined with macro fear overriding fundamentals. In the medium term, this guidance is expected to:


    • Unlock new institutional ETF and fund products built around BTC, ETH, and SOL
    • Reduce the regulatory risk premium priced into crypto assets
    • Enable banks and traditional finance to custody and trade these assets without securities compliance overhead
    • Accelerate stablecoin legislation through Congress (separate but complementary)

The stablecoin market reached $316 billion in March 2026 (KuCoin/Macquarie). USDC has overtaken USDT in YTD volume — $2.2T vs $1.3T (Mizuho Securities, March 13) — a significant signal that regulated, compliance-friendly stablecoins are gaining institutional preference. USDT still leads with 58.25% market dominance, but the trend is clear.

Profitable in Any Market Condition


Join 10,000+ traders using NeuralArB’s neural network technology to profit from market inefficiencies 24/7. Whether the market goes up or down, the spread is yours.


On-Chain Metrics & Market Structure


Bitcoin dominance hovered between 57%–61% throughout the week, ending near 60% — approaching a cycle high. A rising BTC dominance during a downturn is a well known signal of capital rotation into Bitcoin from altcoins, which then typically precedes a phase of altcoin recovery once BTC stabilizes. Total crypto market cap fell to ~$2.43T by March 27 (Rootstone Insights), down from ~$2.52T at the week’s open.


Key on-chain metrics to watch:

    • Stablecoin supply: $316B record — unprecedented dry powder available for re-deployment
    • BTC whale wallets: Accumulation patterns continued despite price decline — smart money buying
    • Open interest: Compressed significantly as leveraged longs were liquidated, reducing volatility risk
    • Exchange stablecoin inflows: Accelerated in the 24–48 hours following the March 27-28 bottom
    • BTC market cap: $1.31T — still representing dominant store-of-value positioning

The Q1 2026 quarterly candle closed down approximately -29.7% from the January open of $93,877 to the March 30 close of ~$65,957. This is a significant quarterly compression, but importantly, Bitcoin is still trading well above its 2025 year-end level and its pre ETF approval ranges. The SEC commodity classification removes a structural overhead that had historically suppressed institutional allocation.

NeuralArB On-Chain Insight: The divergence between retail sentiment (F&G at 13) and whale accumulation behavior is one of the clearest signals in our AI’s pattern library. When fear peaks while smart money buys, our models flag it as a high-probability mean-reversion setup. We observed this pattern in February 2026 (F&G hit 5, BTC recovered to $72K within 3 weeks) and are seeing similar dynamics in late March.


📥 Downloadable Market Data


Get the full OHLC and metric dataset for the week of March 23-30, 2026.


DateBTC CloseETH CloseSOL CloseFear Index
Mar 23$70,245$2,082$90.0025
Mar 25$70,800$2,175$91.7123
Mar 27$68,790$2,059$83.0215
Mar 30$65,957$1,982$81.3414


Top Weekly Gainers & Losers


The divergence between narrative-driven tokens (AI) and general market beta (L1s) was stark this week.

 
AI token TAO bucked the trend (+8.2%) as BTC/ETH/XRP/SOL all shed ~6.6–7.7%


Macro Outlook & Q2 2026 Signals


As Q1 2026 closes with Bitcoin down nearly -29.7% from its January open, the market faces a pivotal inflection point. Yet the bearish surface narrative masks some important nuances:


OANDA analysts note that “Bitcoin is now stabilizing between $65,000 and $70,000 after a near-50% correction from its October highs” — suggesting the market has already digested a significant portion of the macro-driven correction. Conservative estimates from Intellectia.ai suggest BTC could recover to $74,000 by end of Q2 if macro conditions stabilize. Rootstone Insights (March 27) concludes: “Panic pressure has subsided, yet complete recovery not confirmed.”


Meanwhile, Sergey Tereshkin (March 29) observed: “The cryptocurrency market appears to be in a state of reconfiguration” — consistent with our view that the market is transitioning from a distribution/fear phase into early stage smart money accumulation.


Q2 CatalystTimelineImpact AssessmentBullish/Bearish
May FOMC Rate DecisionMay 7, 2026Rate cut = strong bull signalPotential Bullish
Congressional Stablecoin BillQ2 2026Legitimizes $316B marketBullish
Bitcoin ETF Monthly Inflow ReversalApril-May 2026$767M+ weekly inflows resumeBullish
$65,000 BTC Support BreakImmediate RiskDrop to $60K-$62K rangeBearish Risk
AI Token Q2 Revenue ReportsQ2 2026TAO/RENDER sector momentum continuesBullish
Macro/Geopolitical EscalationOngoingRisk-off contagion to cryptoBearish Risk


NeuralArB Arbitrage Signals This Week


The extreme fear environment created significant cross-exchange spread opportunities. BTC spot vs. futures premiums reached unusual levels during the March 27-28 flush. Additionally, the divergence of AI tokens like TAO against falling majors created profitable pair trade setups. Our AI system, monitoring 247+ exchanges, detected accelerated stablecoin inflows to exchanges—a classic “buy the dip” signal from smart money.

How NeuralArB Exploited This Week: When the BTC/ETH spread widened abnormally on March 27-28 during the flush, NeuralArB’s arbitrage engine identified cross-exchange discrepancies exceeding 0.8% — well above our 0.3% threshold trigger. Simultaneously, TAO’s divergence against BTC created a delta-neutral pair trade with a favorable risk/reward ratio. Our stablecoin inflow detector flagged accelerating USDT movements into major exchanges 4–6 hours before the local price stabilization on March 29.


Conclusion: Q1 2026 Closes with a Punch — Q2 Sets Up the Counter


The week of March 23–30, 2026 closed Q1 2026 on a painful note. Bitcoin shed -6.6%, breaking the critical $70,000 support and settling near its quarterly closing low of $65,957. Ethereum fell back below $2,000, Solana shed over 10%, and XRP gave back its +11% gains from the week prior. The Fear & Greed Index hit 13/100 (Extreme Fear) — one of the year’s lowest readings.


Yet within the fear, meaningful signals of resilience emerged:

    • AI tokens outperformed fundamentally — TAO +15.8% while BTC fell -6.6%, confirming the revenue driven narrative thesis
    • Stablecoins hit a record $316B — unprecedented dry powder sitting on the sidelines
    • On-chain whale accumulation continued beneath the fear driven retail selling
    • SEC/CFTC digital commodity classification provides a powerful long-term regulatory tailwind for BTC, ETH, and SOL
    • BTC dominance near 60% sets the stage for an eventual rotation into quality altcoins once sentiment stabilizes

For NeuralArB’s AI-driven arbitrage systems, extreme fear environments are among the most opportunity rich periods of the year. Spreads widen, inefficiencies multiply, and algorithmic edge compounds for those with the tools and discipline to act while others panic. Q2 2026 opens with the $65,000 BTC support level as the critical battleground. A confirmed hold and recovery above $68,500–$70,000 would signal that Q1’s correction is complete.


Stay positioned, stay disciplined. The data tells the real story and the data says smart money is loading up.


💬 Frequently Asked Questions (FAQ)

What was the Bitcoin price during the week of March 23–30, 2026?

Bitcoin opened the week at $70,599 on March 23, 2026 (confirmed by Fortune data), briefly touched a weekly high near $71,310 on March 26, then experienced a significant selloff. By March 27, BTC had broken below the psychological $70,000 support level, falling to $68,790. The week closed on March 30 at approximately $65,957, representing a -6.6% weekly decline. The primary drivers included continued macroeconomic uncertainty, hawkish Fed expectations, and a deteriorating market sentiment with the Fear & Greed Index falling to extreme fear levels of 13/100 — the lowest reading since February 2026.

The crypto market sell-off during this period was driven by multiple converging factors:

1) Persistent macroeconomic uncertainty following the Federal Reserve’s hawkish hold stance from the prior week;

2) The Fear & Greed Index collapsing from 25 (Fear) to 13 (Extreme Fear) by March 27;

3) Technical weakness as Bitcoin lost the key $70,000 psychological support, triggering cascading stop-losses;

4) Mixed Bitcoin ETF flows — the prior week’s $767M inflow streak reversed sharply;

5) General risk-off sentiment closing out Q1 2026, which saw BTC decline ~29.7% from its January open of $93,877;

6) Macro concerns including tariff uncertainties and residual geopolitical tensions in the Middle East.

Ethereum started the week around $2,053–$2,082, briefly climbed to a weekly high near $2,175 on March 25, 2026, then sold off sharply. By March 28, ETH had broken below the critical $2,000 psychological level, trading at $1,991 (per Yahoo Finance). The week closed on March 30 at approximately $1,982 — a -3.5% weekly decline. For context, ETH had surged +13% the prior week; this week nearly gave all of those gains back. The monthly average for March 2026 settled at approximately $2,002 (Digrin data). ETH slightly outperformed XRP and SOL on the downside, showing modest relative strength.

Despite the broad market selloff, AI infrastructure tokens showed notable divergence. Bittensor (TAO) was the standout performer, surging +15.8% to reach $332–$335.45. Other notable gainers included Siren (SIREN) up +103–118%, Venom (VENOM) up +49–71%, and Orochi Network (ON) up +22–54%. The AI token sector was buoyed by TAO generating $43.2M in Q1 2026 revenue and overall AI crypto token demand surging ~95% in March 2026. This AI/L1 divergence echoes a broader theme: fundamental driven tokens with real revenue generation are increasingly decoupling from pure price speculation assets during risk-off periods.

The Crypto Fear & Greed Index (F&G) was firmly in the “Fear” range throughout the week, starting at 25 (Fear) on March 23 and deteriorating sharply to 13 (Extreme Fear) by March 27, 2026 — confirmed by Binance and CryptoRank. By March 28, it remained in extreme fear territory at 13–14. Historically, F&G readings below 15 have often preceded significant market recoveries within 30–60 days, making this a key contrarian watch level. For broader context: the index hit an even lower reading of 5 during the February 16–23 crash, which proved to be a local bottom. MEXC analysts specifically noted: “Fear creates the best opportunities” at these levels.

On March 17, 2026 (the week prior to this report), the U.S. Securities and Exchange Commission (SEC) and Commodity Futures Trading Commission (CFTC) issued a landmark joint 68-page guidance (SEC Press Release 2026-30) classifying 16 cryptocurrencies as “digital commodities” — removing them from securities regulation. Assets named include Bitcoin (BTC), Ethereum (ETH), and Solana (SOL), among others. Reuters described it as long awaited crypto guidance, and Latham & Watkins confirmed the regulatory shift. Despite this fundamentally bullish development, the market still sold off during March 23–30, suggesting that short-term macro and sentiment factors dominated over positive regulatory news. The guidance is expected to unlock a new wave of institutional product development in Q2 2026 and beyond.

Bitcoin ETF flows were mixed to negative during this period. The prior week (Mar 16–23) had seen a strong 5 day ETF inflow streak totaling $767M. However, as BTC began declining, flows reversed. BlackRock’s IBIT had previously recorded a notable $199M single session inflow (the first in 5 weeks), but by late March, outflows resumed. March 20 alone saw $52.1M in net outflows (third consecutive outflow day per KuCoin). Binance reported that Bitcoin ETFs were “on track to record the first monthly outflow in 2026.” Despite this, some institutional players appeared to use the dip as an accumulation opportunity, per on-chain data showing whale wallet activity. BlackRock’s IBIT remained the dominant product in terms of liquidity and institutional preference on inflow days.

The Q2 2026 crypto market outlook is cautiously optimistic despite the challenging Q1 close. Key bullish catalysts include: 

1) The landmark SEC/CFTC “digital commodity” classification removing regulatory uncertainty for major assets; 

2) The stablecoin market at a record $316 billion — representing dry powder for recovery; 

3) Bitcoin dominance near 60% suggesting latent altcoin rotation potential; 

4) Conservative Q2 price targets for BTC at $74,000+ (Intellectia.ai)

5) AI token sector showing real revenue generation ($43.2M for TAO alone in Q1); 

6) Extreme Fear readings historically preceding recoveries. Key risks include Fed rate decisions, ETF outflow continuation, and the critical $65,000 BTC support needing to hold. NeuralArB’s AI models are monitoring all these signals in real time.


📱 Stay Connected:

  • Twitter/X for real-time market alerts
  • Telegram community for live trading discussions

🔗 Related Analysis:


Data Sources:

Disclaimer: This analysis is for educational purposes. Arbitrage trading involves substantial risk, including custody risk, regulatory risk, and execution risk. Past performance is not indicative of future results. Never risk capital you cannot afford to lose. Consult qualified financial and legal advisors before trading.

Max Takeda

Max Takeda is the Chief Technology Officer at NeuralArB, where he leads the company’s technology vision, overseeing the development and implementation of cutting-edge AI algorithms and blockchain solutions that power crypto arbitrage trading efficiency. With a strong background in software engineering, artificial intelligence, and distributed ledger technology, Max combines technical expertise with strategic thinking to drive NeuralArB's mission to revolutionize the cryptocurrency trading space. Connect with Max on Twitter: @MaxTakeda91

Still have questions, contact us:

© 2026 NAB CONSULTANCY LTD. All right reserved.

These materials are for general information purposes only and are not investment advice or a recommendation or solicitation to buy, sell or hold any cryptoasset or to engage in any specific trading strategy. Some crypto products and markets are unregulated, and you may not be protected by government compensation and/or regulatory protection schemes. The unpredictable nature of the cryptoasset markets can lead to loss of funds. Tax may be payable on any return and/or on any increase in the value of your cryptoassets and you should seek independent advice on your taxation position.

All trademarks, logos, and brand names are the property of their respective owners. All company, product, and service names used in this website are for identification purposes only. Use of these names, trademarks, and brands does not imply endorsement.

NAB does not provide investment or brokerage services. All cryptocurrency spot, margin, and futures products are offered by third-party platforms. Products and services availability varies by country.

Past performance, whether actual or indicated by historical or simulated tests of strategies, is no guarantee of future performance or success. There is a possibility that you may sustain a loss equal to or greater than your entire investment regardless of which asset class you trade (i.e. cryptocurrency); therefore, you should not invest or risk money that you cannot afford to lose. Online trading is not suitable for all investors. Before trading any asset class, customers should review NFA and CFTC advisories, and other relevant disclosures. System access, trade placement, and execution may be delayed or fail due to market volatility and volume, quote delays, system and software errors, Internet traffic, outages and other unforeseen factors.

Still have questions, contact us:

© 2026 NAB CONSULTANCY LTD. All right reserved.

These materials are for general information purposes only and are not investment advice or a recommendation or solicitation to buy, sell or hold any cryptoasset or to engage in any specific trading strategy. Some crypto products and markets are unregulated, and you may not be protected by government compensation and/or regulatory protection schemes. The unpredictable nature of the cryptoasset markets can lead to loss of funds. Tax may be payable on any return and/or on any increase in the value of your cryptoassets and you should seek independent advice on your taxation position.

All trademarks, logos, and brand names are the property of their respective owners. All company, product, and service names used in this website are for identification purposes only. Use of these names, trademarks, and brands does not imply endorsement.

NAB does not provide investment or brokerage services. All cryptocurrency spot, margin, and futures products are offered by third-party platforms. Products and services availability varies by country.

Past performance, whether actual or indicated by historical or simulated tests of strategies, is no guarantee of future performance or success. There is a possibility that you may sustain a loss equal to or greater than your entire investment regardless of which asset class you trade (i.e. cryptocurrency); therefore, you should not invest or risk money that you cannot afford to lose. Online trading is not suitable for all investors. Before trading any asset class, customers should review NFA and CFTC advisories, and other relevant disclosures. System access, trade placement, and execution may be delayed or fail due to market volatility and volume, quote delays, system and software errors, Internet traffic, outages and other unforeseen factors.

Still have questions, contact us:

© 2026 NAB CONSULTANCY LTD. All right reserved.

These materials are for general information purposes only and are not investment advice or a recommendation or solicitation to buy, sell or hold any cryptoasset or to engage in any specific trading strategy. Some crypto products and markets are unregulated, and you may not be protected by government compensation and/or regulatory protection schemes. The unpredictable nature of the cryptoasset markets can lead to loss of funds. Tax may be payable on any return and/or on any increase in the value of your cryptoassets and you should seek independent advice on your taxation position.

All trademarks, logos, and brand names are the property of their respective owners. All company, product, and service names used in this website are for identification purposes only. Use of these names, trademarks, and brands does not imply endorsement.

NAB does not provide investment or brokerage services. All cryptocurrency spot, margin, and futures products are offered by third-party platforms. Products and services availability varies by country.

Past performance, whether actual or indicated by historical or simulated tests of strategies, is no guarantee of future performance or success. There is a possibility that you may sustain a loss equal to or greater than your entire investment regardless of which asset class you trade (i.e. cryptocurrency); therefore, you should not invest or risk money that you cannot afford to lose. Online trading is not suitable for all investors. Before trading any asset class, customers should review NFA and CFTC advisories, and other relevant disclosures. System access, trade placement, and execution may be delayed or fail due to market volatility and volume, quote delays, system and software errors, Internet traffic, outages and other unforeseen factors.

btc address
bc1ql27m5pygdxpmnvjzkamaj88mwphwl8q6n9n06l

Only use this insured address for BTC on the Bitcoin network. Do not send Ordinals. Lost funds cannot be recovered.