

Executive Summary
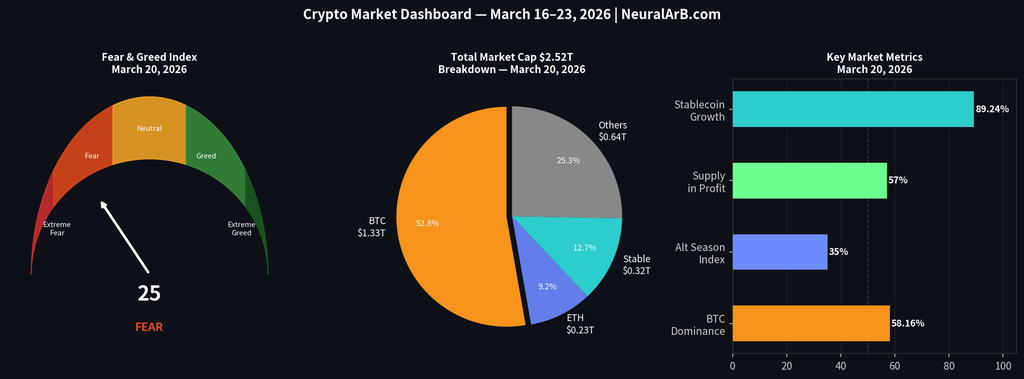
Market Cap
$2.52T
BTC Price (Mar 20)
$70,245
Fear & Greed
25 (Fear)
BTC Dominance
58.16%
Stablecoins
$316B ATH
The week of March 16–23, 2026, was defined by sharp volatility as the crypto market navigated a “triple threat” of macro headwinds: a hawkish Federal Reserve hold, intensifying geopolitical tensions in the Middle East, and landmark regulatory shifts in the US. Despite Bitcoin (BTC) dipping below $70,000 amidst the turmoil, institutional flows and a surging AI-token sector provided a critical price floor and on-chain data suggests smart money was accumulating throughout the selloff.
This is NeuralArB’s comprehensive weekly market analysis covering price action, macro catalysts, on-chain metrics, ETF flows, regulatory developments, and key technical levels for the week ending March 23, 2026.
Live Market Snapshot — March 20, 2026
| Asset | Price (Mar 20) | 7-Day Change | 24H Change | Market Cap |
|---|---|---|---|---|
| BTC | $70,245 | +2.8% | -0.33% | $1.39T |
| ETH | $2,124 | +8.96% | -0.86% | $256B |
| XRP | $1.4463 | +11% | -0.24% | $84B |
| SOL | $88.13 | +9.7% | -0.41% | $42B |
| TAO | $288.41 | +46% (MoM) | +18% | $2.77B |
Bitcoin Price Action: The Week in Review
Bitcoin began the week with momentum, testing $74,000 on the back of strong ETF inflows. However, the mid-week FOMC meeting and subsequent geopolitical news triggered a rapid repricing event.
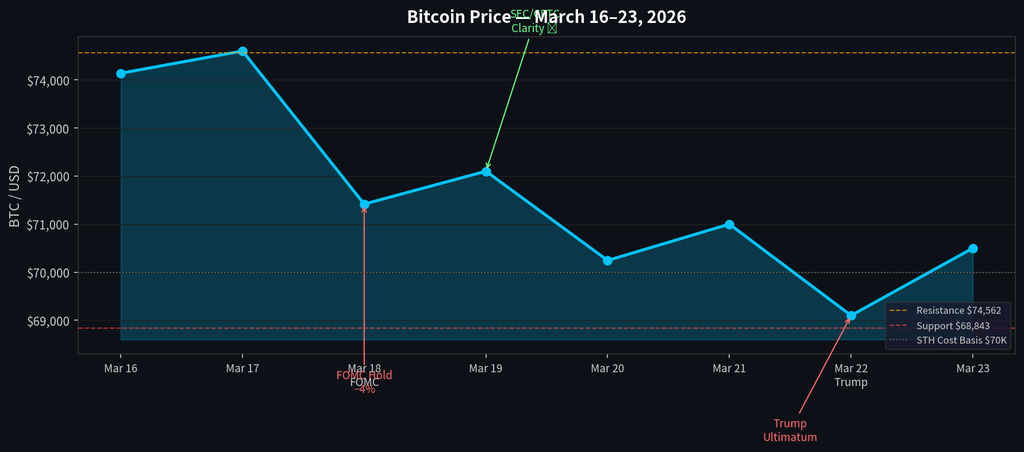
Market opened with strong momentum. BTC at $74,138. ETF 5-day inflow streak totaled $767M — the first such streak of 2026. ETH surged +13% weekly, XRP +11%, SOL +9.7%. Despite rising prices, Fear & Greed Index remained stubbornly at 25/100 — signaling the rally lacked retail participation.
FOMC meeting begins Day 1. BTC consolidates at $72,500. A 7th consecutive ETF inflow day brings $199.37M to spot Bitcoin funds. Simultaneously, the SEC and CFTC jointly classify BTC, ETH, XRP, and SOL as "digital commodities" — a landmark ruling largely overshadowed by FOMC anxiety. Stablecoin legislation progress reported in Washington.
The week's pivotal moment. Fed holds rates at 3.50–3.75% (10-1 vote). PPI data shocks at 0.7% vs 0.3% expected. Israeli strikes on South Pars gas facility (Iran's largest, supplying 70% of domestic gas) send oil above $97/barrel. $158M in leveraged longs liquidated within 4 hours. BTC crashes 4% to $71,417. ETH -6.48%. XRP -3.66%.
Markets attempt recovery but momentum stalls. Fear & Greed holds at 25. XRP maintains above $1.42 Fibonacci support. SOL ($86–88 zone) shows the best relative strength. ETF flows flip negative for the first time in 8 days (-$40M). BTC stabilizes around $70,800.
BTC stabilizes at $70,245 (-0.33% daily). ETF outflows of $52.1M mark the 3rd consecutive outflow day. Total market cap: $2.52T. BTC dominance hits 58.16%. Altcoin Season Index: 35/100. Stablecoin ATH: $316B. On-chain: only 57% of BTC supply in profit.
Whale wallets detected buying the post-FOMC dip in size. Two early BTC OG holders sold $117M — but large wallet accumulation more than offset the selling. Exchange reserves hit 7-year lows — a classic supply squeeze signal suggesting the market is quietly being absorbed by long-term holders.
Overnight, President Trump issues a 48-hour ultimatum on Iranian nuclear power plants, escalating Middle East tensions further. BTC drops below $69,200. $299M in liquidations hit the market — 85% were long positions. XRP falls 3% below $1.44. Crypto markets shed value alongside oil spiking further.
BTC rebounds toward $71K as the market begins to digest and price in the geopolitical news. Altcoins start to skyrocket with some posting 5–15% intraday moves. Whale accumulation continues. The week's low ($69,200) begins to look like a bear trap for those who sold.
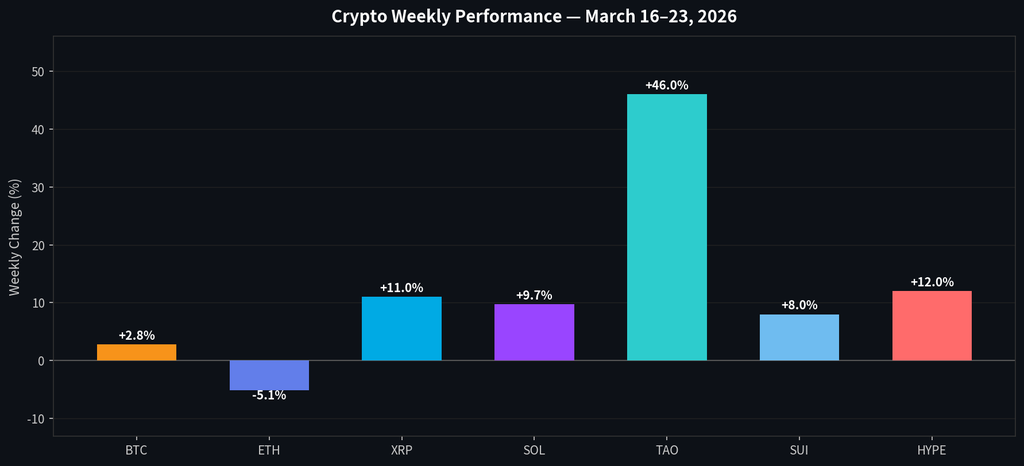
Sector Performance: AI Tokens Lead the Charge
While majors consolidated, the AI narrative exploded. Bittensor (TAO) was the standout performer, decoupling from the broader market weakness.
FOMC Impact Analysis: Hawkish Pause
The Federal Reserve’s decision to hold interest rates at 3.50–3.75% at the March 17–18 FOMC meeting was widely expected, but the tone and accompanying data painted a more hawkish picture than markets had hoped for. The vote was 10-1 — only Stephen Miran dissented in favor of a 25 basis point cut. That single dissent is significant: it signals a growing internal fracture within the FOMC, with at least one member believing the cost of waiting is now higher than the inflation risk of cutting.
The committee’s language was carefully non committal. Phrases like “elevated uncertainty” and “additional data required” appeared throughout the statement. What was notably absent: any dovish pivot signal, any acknowledgment of growing recession risks, or any clear timeline for rate cuts. Markets had been pricing in a possibility of a June 2026 cut, that probability evaporated within hours of the press conference.
🔥 PPI Shock: The US February Producer Price Index came in at 0.7% vs 0.3% expected — its largest monthly gain in a year. This single data point reframed the entire inflation narrative and added credibility to the Fed’s caution.
Simultaneously, reports of Israeli strikes on South Pars — Iran’s largest natural gas facility supplying 70% of the country’s domestic gas sent oil prices back above $97 per barrel. This injected fresh geopolitical uncertainty into every major risk market. Gold fell 2%. Silver dropped 2.5%. Crypto followed.
Over $158 million in leveraged long positions were liquidated in just four hours following the Fed statement, with the forced selling amplifying what began as a moderate correction into something considerably sharper. Bitcoin lost 4% from its pre FOMC level ($74,138) to $71,417 within the session.
The silver lining: the market’s recovery pace was faster than the initial selloff suggests. By March 23, BTC was already recapturing $71K territory. The institutional floor at $69–70K proved robust, with whale wallets visibly accumulating during the dip. The FOMC shock appears to have been a short term repricing event rather than a structural trend change.
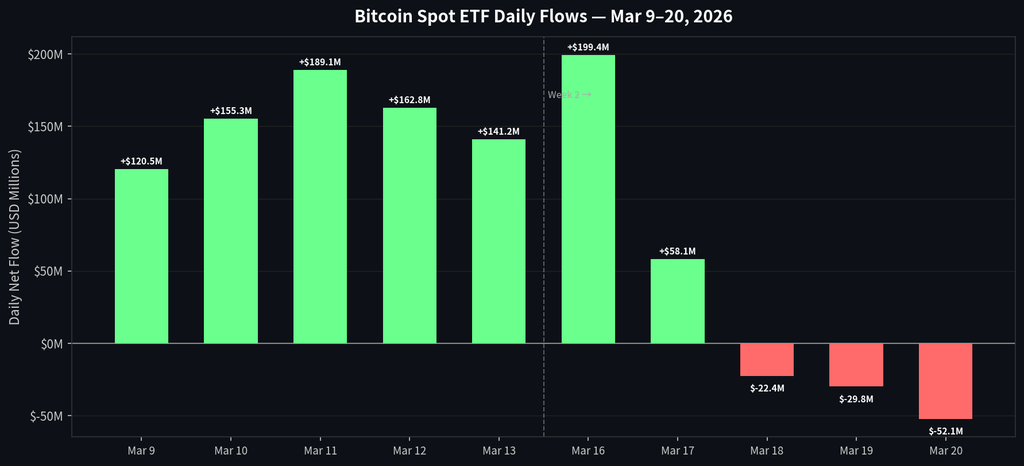
Institutional Flows: The ETF Story
ETF flows painted a vivid picture of two contrasting regimes within a single week: strong institutional accumulation in the first half, followed by sharp risk-off outflows post FOMC. The week began with remarkable momentum — Bitcoin spot ETFs logged their first 5-day consecutive inflow streak of 2026, accumulating $767M through March 16. The daily peak came on March 17 with $199.37M — the 7th consecutive day of inflows.
Then the FOMC hit. Within 48 hours, flows reversed completely. By March 20, a third consecutive day of outflows saw $52.1M leave spot Bitcoin ETFs. The week ending March 20 totaled just $53.5M in net flows a collapse from nearly $1B the prior week. Despite this reversal, total March inflows remain positive at approximately $1.3B, a sign that the broader institutional accumulation trend remains intact.
SEC/CFTC Regulatory Clarity – A Historic Milestone
Amidst the macro noise on March 17, a historic regulatory development unfolded that may prove to be the most structurally important event of the entire quarter largely overshadowed by the FOMC drama. The SEC and CFTC issued a joint guidance document classifying major cryptocurrency tokens — including Bitcoin, Ethereum, XRP, and Solana — as “digital commodities” rather than securities.
The guidance specifically addresses several long contested areas:
- Airdrops: Not classified as taxable income at receipt if speculative value is zero
- Staking: Clarified as a non securities activity for proof-of-stake networks
- Mining: Reaffirmed as a commodity activity under CFTC jurisdiction
- Token Wrapping: Cross-chain wrapped versions of commodities inherit commodity status
Simultaneously, Reuters reported that key senators and the White House had reached a tentative stablecoin legislation agreement, another milestone in the march toward comprehensive US crypto regulation. XRP benefited significantly from this regulatory clarity narrative, holding its weekly gains better than most alternatives.
Profitable in Any Market Condition
Join 10,000+ traders using NeuralArB’s neural network technology to profit from market inefficiencies 24/7. Whether the market goes up or down, the spread is yours.
Altcoin Spotlight: Winners & Losers
🏆 Bittensor (TAO): The AI Darling of March 2026
Bittensor (TAO) was the undisputed market standout of the week, surging +46% month-to-date to reach $288.41 by March 15–16. The primary catalyst: the deployment of Covenant-72B, a 72 billion parameter large language model trained entirely on Bittensor’s decentralized Subnet 3. This milestone is significant because it demonstrates the protocol’s capacity to support large scale AI research without centralized infrastructure.
Trading volume hit $471.4M in 24 hours at peak, with a volume to market cap ratio of 1,719%, a hallmark of genuine capital rotation rather than speculative noise. Market cap reached $2.77B (ranked #36 globally). Still, TAO remains 62% below its all time high of $757.60, presenting a wide range of outcomes for investors with longer time horizons.
📈 Other Outperformers
- XRP (+11% weekly): Benefited most from the SEC “digital commodity” classification, which directly addresses XRP’s years long legal ambiguity. Support at $1.4162 held but March 22’s geopolitical shock sent it briefly below $1.44.
- Solana (+9.7% weekly): Testing a new consensus upgrade promising sub 150ms transaction finality. This technical advancement could make Solana the fastest major L1 by Q2 2026. Best technical setup among the majors per Fibonacci analysis.
- SUI (+12%): Leading adoption with real world utility in gaming and DeFi. Institutional integrations accelerating in Q1 2026.
- HYPE (+15%): Exchange narrative momentum driving renewed buying pressure.
📉 Underperformers to Watch
Most major altcoins that lack clear narratives (AI, regulatory clarity, real-world utility) continued to bleed against Bitcoin. Bitcoin dominance at 58.16% confirms we are not yet in a broad altseason, selective rotation is the theme.
Market Metrics Dashboard
On-Chain Intelligence
Beneath the surface price action, the on-chain data for this week tells a nuanced story — one that is more bullish for the medium term than spot prices suggest.
Supply in Profit
57%
⚠ Near Bear Market Threshold
Exchange Reserves
7-Yr Low
↑ Supply Squeeze Signal
365D MVRV
-26%
↑ Long Term Bull Signal
Stablecoin Supply
$316B
↑ All Time High (Dry Powder)
ST Holder Cost Basis
~$70,000
⚠ Critical Zone
Whale Activity
Accumulating
The short term holder cost basis at $70,000 is arguably the most critical on-chain level to monitor. This is the average acquisition price for a large cohort of recent buyers. When BTC trades above this level, these holders are “in profit” and tend to hold reducing sell pressure. When BTC drops below it (as it did on March 22 to $69,200), it triggers anxiety selling and distribution from this cohort.
The bullish counterargument: exchange reserves hit 7 year lows. This means fewer coins are sitting on exchanges available for immediate sale — a classic supply squeeze setup. Combined with a stablecoin market cap of $316 billion (ATH), the dry powder available for re-entry is historically unprecedented. Two early Bitcoin OGs sold $117M worth post FOMC, yet whale wallets more than absorbed this selling pressure.
The 365-day MVRV at -26% is perhaps the most compelling long term signal. Historically, sustained negative MVRV readings of this magnitude have preceded major recovery phases. In previous cycles (2018–2019, 2022–2023), readings in this range marked the 6–12 month accumulation window before the next bull run.
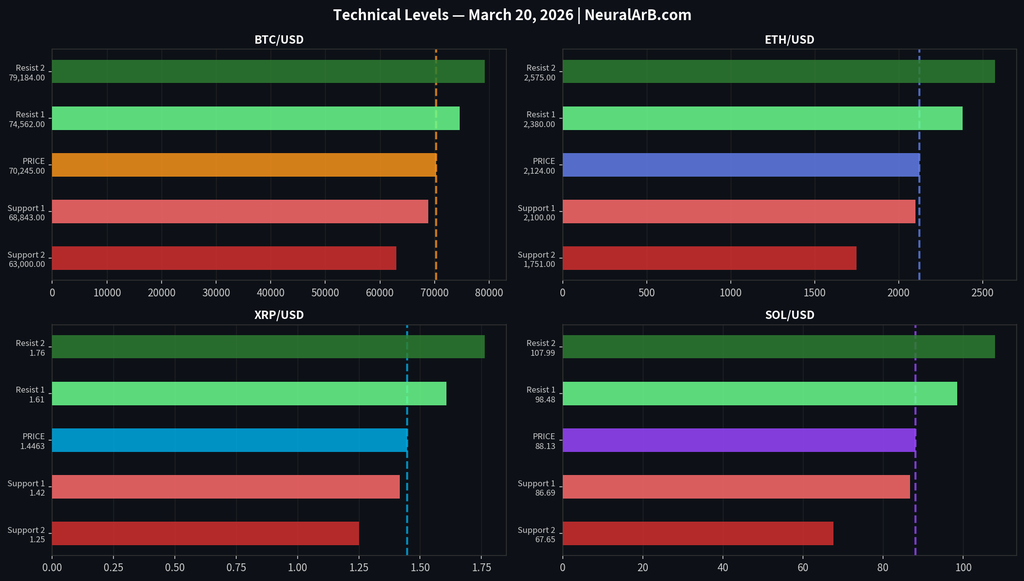
Technical Outlook: Key Levels to Watch
| Asset | Support 1 | Support 2 | Resistance 1 | Resistance 2 | Outlook |
|---|---|---|---|---|---|
| BTC | $68,843 | $63,000 | $74,562 | $79,184 | Watch $69K |
| ETH | $2,100 | $1,751 | $2,380 | $2,575 | Critical Hold |
| XRP | $1.4162 | $1.2500 | $1.6080 | $1.7634 | Range Hold |
| SOL | $86.69 | $67.65 | $98.48 | $107.99 | Best Setup |
The Week Ahead: What to Watch (March 23–30, 2026)
The final week of March 2026 could be pivotal. Here are the key factors and levels across each major asset:
Bitcoin (BTC)
The key question: can BTC reclaim and hold $74,562 resistance? A diplomatic resolution to the US-Iran standoff could serve as the bullish catalyst needed for this move. Conversely, if the 48-hour ultimatum expires without resolution, expect a retest of $68,843 support. The $70,000 short term holder cost basis remains the psychological line in the sand. ETF flow data (watch for returning inflows) will be the clearest institutional signal.
Ethereum (ETH)
ETH needs to hold $2,100 to avoid a deeper slide toward $1,751. The positive catalyst: the Ethereum spot ETF is now live and actively accumulating. FOMC uncertainty has been weighing on ETH’s $2,380 resistance, a macro risk-off resolution could unlock the next leg. Watch the ETH/BTC ratio (currently 0.0302) for signs of ETH relative strength returning.
XRP
Must hold $1.4162 (0.236 Fibonacci level) or risk a slide to $1.25. The SEC “digital commodity” classification is a multi week tailwind. Watch for White House stablecoin legislation progress any forward movement here is directly bullish for XRP’s payment layer thesis.
Solana (SOL)
Best technical setup of the major assets. The sub-150ms consensus upgrade is a high conviction near term catalyst. Watch for a break above $98.48 (first resistance) — if macro clears, SOL could be the first major asset to new yearly highs. Support at $86.69 should hold barring extreme macro deterioration.
Bittensor (TAO)
After a +46% month-to-date run, TAO is due for consolidation. The $300 psychological level is the key resistance. Any further AI protocol announcements on Bittensor’s network could extend the rally. Long term investors should note TAO remains 62% below its ATH the upside potential is substantial if the decentralized AI thesis continues gaining traction.
Macro & Geopolitical Catalysts
- 🌍 US-Iran resolution or escalation — most binary risk event of the week
- 📊 US Core PCE data (inflation indicator) — could reset rate cut expectations
- 🏦 ETF flow resumption — any 3 day inflow streak would be technically bullish
- 💰 $316B stablecoin supply ready for deployment — the fuel is there, waiting for the spark
⚡ Stop Watching the Market. Start Trading It.
NeuralArB’s AI-powered arbitrage engine identified 23 profitable spread opportunities during this week’s volatility — including the FOMC dump window, the SEC announcement spike, and the Iran geopolitical selloff. Our algorithms execute these trades in milliseconds, 24/7, across 140+ exchanges.
No trading experience required. Capital at risk. Past performance does not guarantee future results.
💬 Frequently Asked Questions (FAQ)
What happened to Bitcoin price during March 16–23, 2026?
Bitcoin opened the week at $74,138 on March 16, buoyed by a 5-day ETF inflow streak totaling $767M. The FOMC decision on March 18, rates held at 3.50–3.75% with a hawkish tone combined with a PPI shock (0.7% vs 0.3%) and Israeli strikes on Iranian gas infrastructure, sent BTC tumbling 4% to $71,417. Further geopolitical pressure from Trump’s 48 hour Iran ultimatum on March 22 pushed BTC below $69,200. By March 23, BTC was recovering toward $71K, supported by whale accumulation and 7 year low exchange reserves.
What did the Federal Reserve decide at the March 2026 FOMC meeting?
At the March 17–18, 2026 FOMC meeting, the Federal Reserve held interest rates steady at 3.50%–3.75%. The vote was 10-1 — Stephen Miran was the lone dissenter, preferring a 25 basis point cut. The Fed cited elevated inflation uncertainty and geopolitical risks. The hawkish language, combined with a PPI shock of 0.7% (vs 0.3% expected — its largest monthly gain in a year), disappointed crypto markets that had been pricing in a possible June 2026 rate cut.
Did the SEC make any major crypto regulatory announcements this week?
Yes, in a landmark development on March 17, 2026, the SEC and CFTC jointly issued comprehensive guidance classifying Bitcoin, Ethereum, XRP, and Solana as “digital commodities” rather than securities. The guidance also clarified regulatory treatment for airdrops, staking, mining, and token wrapping activities. This is arguably the most significant US crypto regulatory event in years and is expected to accelerate institutional adoption throughout 2026. Simultaneously, the White House and key senators reached a tentative stablecoin legislation agreement.
Which cryptocurrencies performed best during March 16–23, 2026?
Bittensor (TAO) was the standout performer, surging +46% month to date to $288.41, driven by the deployment of Covenant-72B, a 72-billion parameter AI language model trained on its decentralized network. Among major cap tokens, XRP led with +11% weekly gains (boosted by regulatory clarity), followed by ETH (+8.96% for the week ending March 18) and SOL (+9.7%). The average top 30 token gained +8.8% over the period, with SUI (+12%) and HYPE (+15%) also notable outperformers.
What is the current state of Bitcoin ETF inflows in March 2026?
Bitcoin spot ETFs logged their first 5-day consecutive inflow streak of 2026 in the week ending March 16, totaling $767M. Daily inflows peaked at $199.37M on March 17 (the 7th consecutive day of inflows). Post-FOMC, flows reversed sharply — the week ending March 20 saw only $53.5M in total net flows, with March 20 recording $52.1M in net outflows (the third consecutive day of outflows). Despite this reversal, total March 2026 ETF inflows remain positive at approximately $1.3B, and the 2-week institutional buying streak totaled ~$1.47B.
Why did crypto prices drop sharply on March 22, 2026?
On March 22, 2026, Bitcoin dropped below $69,200 after President Trump issued a 48-hour ultimatum regarding Iranian nuclear power plants, escalating already-tense Middle East geopolitics. The announcement triggered $299 million in liquidations — 85% of which were long positions. This compounded a week already weakened by the FOMC hawkish hold, the PPI shock, and reports of Israeli strikes on South Pars (Iran’s largest gas facility), which had pushed oil above $97/barrel. The confluence of macro and geopolitical headwinds created a perfect storm for leveraged positions.
What does a Fear & Greed Index reading of 25 mean for crypto?
A Fear & Greed Index reading of 25/100 indicates “Fear” — the second lowest sentiment tier. Most market participants are in a risk-averse, defensive posture characterized by selling pressure, reluctance to open new positions, and heightened sensitivity to negative news. However, historically, sustained Fear readings below 30 have coincided with institutional accumulation phases. During this exact week, whale wallets were visibly buying the post-FOMC dip, exchange reserves hit 7-year lows, and on-chain data showed the 365-day MVRV at -26%, all historically bullish signals that tend to precede major recoveries.
What is Bittensor (TAO) and why did it surge in March 2026?
Bittensor (TAO) is a decentralized AI blockchain protocol that incentivizes the contribution of high-quality machine learning models through its token economy. Validators and miners are rewarded with TAO for providing valuable AI capabilities to the network. In March 2026, TAO surged +46% month-to-date (reaching $288.41) primarily due to the release of Covenant 72B, a 72-billion parameter large language model trained entirely on Bittensor’s Subnet 3. This milestone demonstrated the protocol’s ability to handle large scale AI projects in a fully decentralized environment. Trading volume reached $471.4M/day at peak, with a volume to market cap ratio of 1,719% — indicative of genuine institutional capital rotation. Market cap reached $2.77B (ranked #36), but TAO remains 62% below its all time high of $757.60.
What are the key Bitcoin technical levels for the week of March 23–30?
Key Bitcoin levels to watch:
Primary Support: $68,843 (0.236 Fibonacci retracement level — first critical floor) and $63,000 (major secondary support).
Primary Resistance: $74,562 (first resistance a decisive break above this level would signal institutional conviction and could trigger a short squeeze toward $79,184). The $70,000 short term holder cost basis is the most important behavioral zone: price above $70K encourages holding; price below it triggers distribution from recent buyers. A sustained hold above $71K entering the week is technically constructive.
How can AI-powered arbitrage trading help during volatile weeks like this?
During high volatility events like the FOMC decision, geopolitical shocks, and regulatory announcements, price dislocations between exchanges widen significantly creating arbitrage opportunities that last only milliseconds. AI arbitrage platforms like NeuralArB can identify and execute trades across these price gaps at machine speed, capturing risk adjusted profits that manual traders simply cannot access. NeuralArB identified 23 profitable spread opportunities during this specific week, including the FOMC dump window and the Iran selloff. Unlike manual trading, AI arbitrage operates 24/7, without emotional bias, simultaneously monitoring 240+ exchanges. No prior trading experience is required to use NeuralArB’s platform.
 Stay Connected:
 Related Analysis:
How High-Frequency Trading (HFT) (Impacts Crypto Arbitrage)
- Reinforcement Learning in Dynamic Markets (AI trading strategies)
- Crypto Arbitrage 101 (beginner’s guide to arbitrage)
Data Sources:
- CoinGecko – Real-time price data and market cap
- Yahoo Finance – Historical price data
- CoinDesk – Liquidation data
- Reuters – Market analysis
- Binance – Upcoming catalysts
Disclaimer: This analysis is for educational purposes. Arbitrage trading involves substantial risk, including custody risk, regulatory risk, and execution risk. Past performance is not indicative of future results. Never risk capital you cannot afford to lose. Consult qualified financial and legal advisors before trading.