

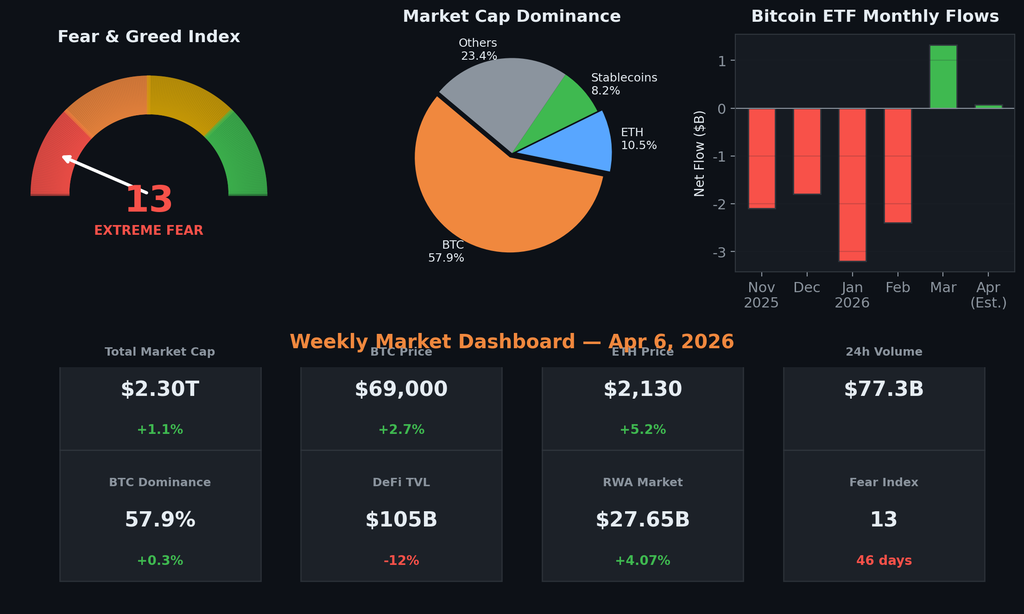
Executive Summary / TL;DR
- Total Crypto Market cap: $2.30T (+1.1%)
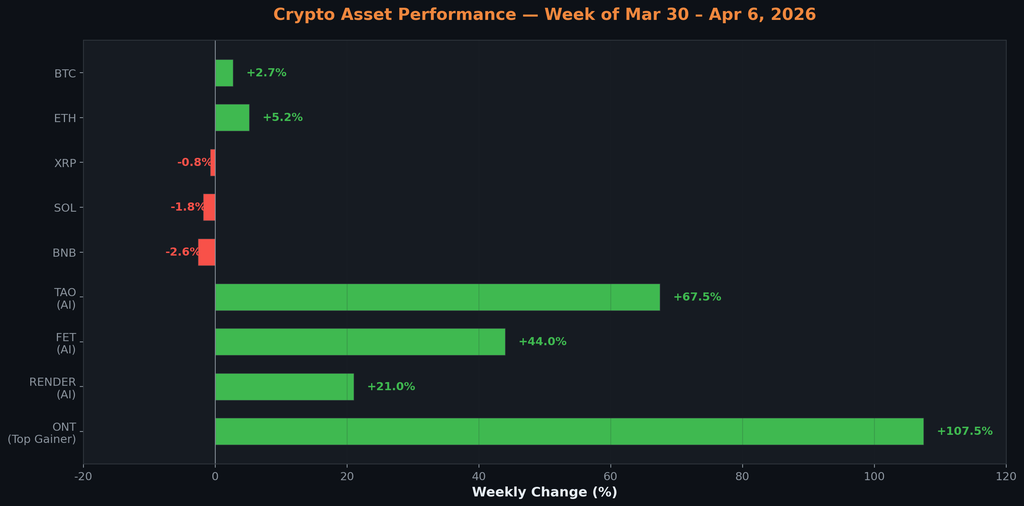
- BTC: ~$69,000 (+2.7% weekly) | ETH: ~$2,130 (+5.2%)
- XRP: $1.35 (-0.8%) | SOL: $80 (-1.8%) | BNB: $600 (-2.6%)
- Fear & Greed Index: 13 (Extreme Fear) — marking 46 consecutive days.
- BTC ETFs: $69.6M inflows in early April; March saw $1.32B net inflow (first positive month since Oct 2025).
- BlackRock: Pulled in $1.7B through the iShares Bitcoin Trust over the past 4 weeks.
- Drawdown: BTC is down 46% from its $126K all-time high.
- Historical Context: Q1 2026 closed with 5 consecutive red monthly candles, a trend not seen since the 2018-19 bear market.
- Top DeFi Event: $285M Drift Protocol exploit (largest DeFi hack of 2026).
- AI Tokens Outperform: TAO +67.5%, FET +44%, RENDER +21%.
- RWA Market: Tokenized RWA market hits $27.65B (+4.07%).
- Macro Headwinds: US-Iran conflict pushing oil above $106/barrel, Trump’s 15% global tariff, SCOTUS tariff ruling pending, and strong NFP (228K) delaying Fed cuts.
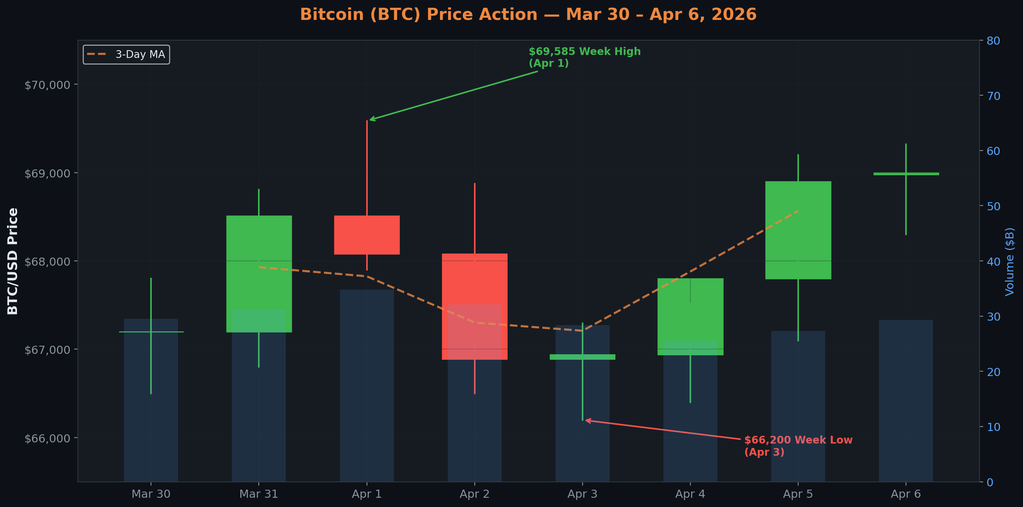
Bitcoin (BTC) Weekly Analysis
Bitcoin’s market structure remains a complex battleground of institutional accumulation and retail capitulation. Opening the week at approximately $67,200 on March 30, BTC pushed to a weekly high of $69,585 on April 1 before retreating to a low of $66,200 by April 3. It closed the period hovering near the $69,000 resistance zone on April 6, up 2.7% for the week.
Taking a step back, the broader timeframes paint a sobering picture for trend followers. The first quarter of 2026 officially ended with five consecutive red monthly candles. We have not witnessed a continuous drawdown of this duration since the depths of the 2018-2019 bear market. The divergence between spot demand and institutional flows is stark; on a 30-day basis, BTC spot demand reads at a negative -63,000 BTC, despite aggressive corporate accumulation and ETF inflows.
Liquidity constraints exacerbated the volatility this week. The Good Friday CME closure and subsequent ETF pause stripped the market of its most reliable bid, exposing the fragility of the current price floor. Furthermore, the macroeconomic environment dealt a blow to bulls hoping for immediate monetary easing. The March Non-Farm Payroll (NFP) print arrived hot at 228,000 against a 185,000 consensus. This data point materially reduced the probability of a near-term Fed rate cut, extending the “higher for longer” narrative.
Despite the bearish optics, institutional analysts maintain a constructive long-term outlook. Fidelity Digital Assets noted this week that Bitcoin’s 50% drawdown from its $126K all-time high signals a “maturing market” rather than a secular bear collapse, pointing to reduced volatility relative to prior cycles. Moreover, on-chain data confirms that miners are predominantly holding rather than selling, establishing a natural supply floor.
From a technical standpoint, the key levels to monitor are strong support at $65,000 and critical resistance at $75,000. For active traders, institutional setups (such as those from Capital Street FX) suggest near-term ranges with entries around 69,000, looking for take profits lower if macro headwinds intensify, while maintaining strict stop-losses above key structural resistance.
| Date | Open | High | Low | Close |
|---|---|---|---|---|
| Mar 30 | $67,200 | $68,805 | $66,900 | $68,500 |
| Mar 31 | $68,500 | $69,585 | $67,800 | $69,100 |
| Apr 1 | $69,100 | $69,585 | $68,000 | $68,900 |
| Apr 2 | $68,900 | $69,321 | $66,938 | $67,515 |
| Apr 3 | $67,515 | $67,296 | $66,200 | $66,889 |
| Apr 4 (Good Friday) | $66,889 | $67,200 | $66,500 | $67,078 |
| Apr 5-6 | $67,078 | $69,870 | $67,755 | $69,000 |
Ethereum & Major Altcoin Analysis
While Bitcoin navigates its macro hurdles, the altcoin ecosystem presents a heavily fractured landscape. Capital is aggressively rotating out of legacy Layer-1s and into emerging narratives, specifically artificial intelligence (AI) and real-world assets (RWA).
Ethereum (ETH) closed the week at $2,130, up a solid 5.2%. Technically, ETH is testing the crucial 0.618 Fibonacci retracement support level, while the ETH/BTC ratio languishes at multi-year lows. However, fundamental catalysts are on the horizon. The upcoming Fusaka Hard Fork and the highly anticipated Glamsterdam upgrade targeted for June are beginning to draw speculative capital. Historical precedent suggests significant pre-event rallies: The Merge drove a 35% surge, the Shanghai upgrade 40%, and Dencun 20%, typically initiating 4-6 weeks prior to the event.
Ripple (XRP) traded flat at $1.35. Despite the sluggish price action, the institutional narrative is gaining momentum. ETF filing conversations are accelerating among major asset managers. Concurrently, the CLARITY Act is advancing through the Senate Banking Committee, which could provide the definitive regulatory framework XRP requires for widespread institutional adoption.
Solana (SOL) continues to struggle, closing the week at $80. The asset has printed 6 consecutive red monthly candles, confirming a bearish Head & Shoulders breakdown. SOL currently sits 71% below its cycle all-time high, though underlying network metrics, such as DEX volume remain surprisingly robust.
Binance Coin (BNB) slipped to $600. The primary catalyst for BNB remains the potential resolution of Binance’s ongoing legal entanglements in the U.S. Meanwhile, regular token burns continue to provide a deflationary undertone to the asset’s tokenomics.
The undisputed champions of the current market cycle are AI Tokens. This is the only sector exhibiting genuine, sustained positive momentum. Projects at the intersection of decentralized compute and machine learning are absorbing vast amounts of liquidity. Bittensor (TAO) exploded by +67.5%, Fetch.ai (FET) surged +44.0%, and Render (RENDER) added +21.0%. Supporting this speculative frenzy is real on-chain utility; Solana’s DEX volume, heavily driven by AI token trading, has nearly doubled from $40.5 billion to $87.8 billion weekly since August 2025.
| Asset | Price | Weekly % | Monthly % | Key Catalyst |
|---|---|---|---|---|
| BTC | $69,000 | +2.7% | -8.3% | ETF inflows resume |
| ETH | $2,130 | +5.2% | -1.6% | Glamsterdam upgrade June |
| XRP | $1.35 | -0.8% | +0.7% | ETF filing momentum |
| SOL | $80 | -1.8% | -5.0% | H&S breakdown risk |
| BNB | $600 | -2.6% | -3.1% | Regulatory resolution |
| TAO | — | +67.5% | — | AI sector leader |
| FET | — | +44.0% | — | AI sector momentum |
| RENDER | — | +21.0% | — | AI sector rotation |
Market Sentiment & On-Chain Intelligence
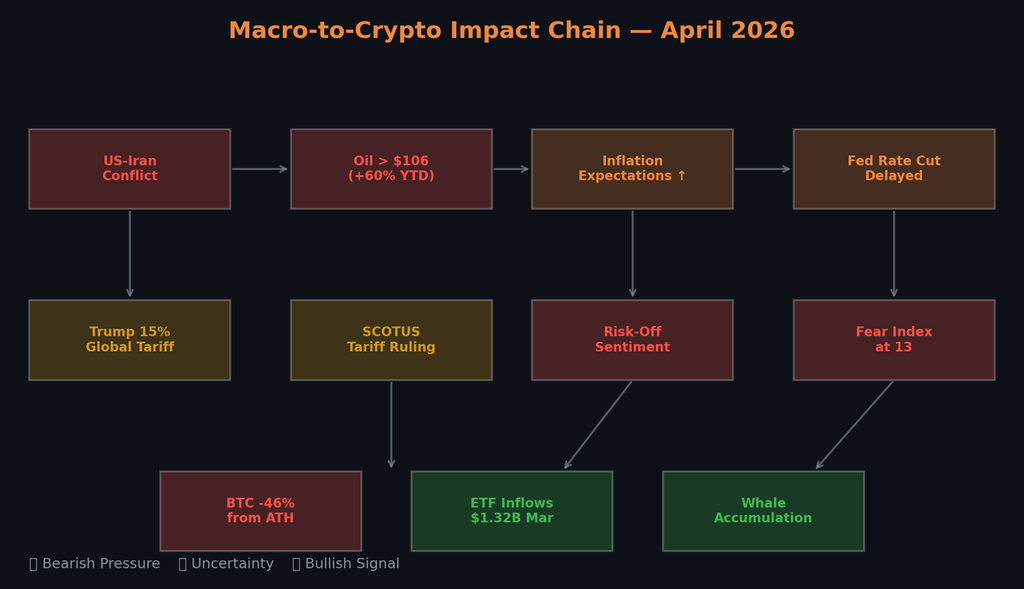
If there is a single metric defining the current state of the crypto market, it is the Crypto Fear & Greed Index. As of April 6, the index sits at 13 (Extreme Fear), having touched a chilling low of 9 earlier in the week. The market has now spent 46 consecutive days in extreme fear territory.
To put this in perspective, current fear levels are deeper and more sustained than the periods surrounding the FTX collapse, the Terra/Luna death spiral, and the March 2020 COVID-19 liquidity crisis. The sentiment data is screaming maximum pain.
However, beneath the surface lies the most critical divergence of 2026: While retail investors are at panic lows, institutional capital is quietly, systematically building massive positions.
Over the past four weeks, BlackRock’s iShares Bitcoin Trust (IBIT) alone absorbed a staggering $1.7 billion. In the first week of April, Bitcoin ETFs saw $69.6 million in net inflows. Furthermore, March 2026 closed with $1.32 billion in net ETF inflows—the first positive month for fund flows since October 2025. This creates a profound disconnect. Spot demand on exchanges is highly negative (-63,000 BTC on a 30-day basis), driven by retail capitulation, yet ETFs are scooping up supply at a relentless pace.
This accumulation trend is not isolated to Bitcoin. Whale activity across the broader altcoin ecosystem is signaling strong institutional conviction:
- XRP: Massive exchange outflow surges indicate that holders are moving tokens into cold storage, significantly reducing immediate sell pressure.
- Bitcoin Cash (BCH): Whales added roughly 260,000 coins (valued at approximately $120 million) in a single week.
- Cardano (ADA): The network’s largest holders accumulated an additional 150 million ADA.
- Chainlink (LINK): Whale supply is rapidly building, highly correlated with the accelerating Real-World Asset (RWA) tokenization narrative.
Historically, this specific divergence retail terror met with institutional accumulation, resolves violently upward once macroeconomic pressures alleviate and supply shock mechanics take hold.
Profitable in Any Market Condition
Join 10,000+ traders using NeuralArB’s neural network technology to profit from market inefficiencies 24/7. Whether the market goes up or down, the spread is yours.
The Macro Storm: Geopolitics, Tariffs, and the Fed
The cryptocurrency market does not exist in a vacuum. In April 2026, digital assets are entirely beholden to a raging macroeconomic and geopolitical storm. The single most important variable dictating price action across all asset classes: crypto, equities, and forex alike is the escalating US-Iran conflict.
The transmission mechanism to crypto is direct and punitive. The conflict has pushed Brent crude oil above $106 per barrel, a staggering ~60% increase since tensions began. High oil prices feed directly into elevated inflation expectations. Higher inflation forces the Federal Reserve to reprice its rate cut schedule, extending tight monetary conditions. This liquidity drain lands squarely on risk-on assets like Bitcoin.
We saw this mechanism play out in real-time this week. On Tuesday, Bitcoin spiked to $69,170 on rumors of diplomatic progress. A risk-on rally commenced. Hours later, former President Trump went on television issuing hawkish statements regarding global trade and tariffs. Oil immediately jumped 5-6%, and the crypto rally collapsed entirely.
Any peace signal triggers a risk-on impulse; any hawkish statement causes immediate reversal.
Complicating matters is the impending global trade war. A 15% global tariff proposed by Trump was recently enacted after the Supreme Court (SCOTUS) struck down previous IEEPA tariffs. The market is now holding its breath for a secondary SCOTUS tariff ruling, which is imminent. A ruling against the administration’s tariff policies would likely weaken the US Dollar and trigger a massive risk-on rally across assets. Currently, the average effective US tariff rate sits at 10.3%, a multi-decade high strangling global liquidity.
Monetary policy offers no immediate relief. The March NFP print of 228,000 thoroughly dismantled consensus expectations of 185,000. A resilient labor market gives the Fed zero incentive to ease. While the thesis for a rate cut in September or December 2026 remains intact, it has been significantly delayed.
In traditional finance, the EUR/USD pair is approaching heavy resistance, with Rabobank projecting a 1.18 target over 12 months. Gold, the traditional safe haven, is trading around $4,500, having recovered from a steep $1,000+ drop from its record highs. The combination of the SCOTUS tariff wildcard and potential Iran escalations sitting simultaneously on the near-term calendar guarantees that volatility will persist.
DeFi Shakeout & Regulatory Developments
April began with a severe shock to the decentralized finance ecosystem. On April 1, the Solana-based Drift Protocol suffered a catastrophic $285 million exploit, the largest single DeFi hack of 2026. Attackers drained USDC from the protocol’s vaults, prompting fierce community backlash against Circle (the issuer of USDC) for allegedly failing to freeze the stolen funds promptly. The event starkly highlighted a persistent philosophical tension in the space:
Decentralized systems still depend on centralized decision makers in critical moments.
Even before the Drift exploit, security was deteriorating; crypto hacks surged to $52 million in March 2026 alone. Despite the exploit and negative price action, Total Value Locked (TVL) across DeFi demonstrated relative resilience. TVL fell from $120 billion to $105 billion (-12%), a drawdown significantly less severe than the price drops of the underlying collateral tokens. Furthermore, innovation continues: USDD crossed the $2 billion TVL threshold, and TermMaxFi successfully introduced one-click rollovers for fixed-rate DeFi, improving capital efficiency.
The brightest spot in the digital asset landscape remains Real-World Asset (RWA) tokenization. The RWA market reached $27.65 billion in early April, rising 4.07% despite the broader crypto downturn. Driven predominantly by tokenized US Treasuries, this growth serves as a powerful signal of institutional confidence in blockchain infrastructure as a settlement layer.
On the regulatory front, April is shaping up to be a historic month:
- The CLARITY Act: This landmark legislation is advancing through the Senate Banking Committee, with a critical markup scheduled for mid-April. If passed, it will definitively categorize assets and provide a registration framework for exchanges.
- SEC Actions: The SEC issued a new interpretation clarifying how federal securities laws apply to crypto assets, while simultaneously classifying 16 specific cryptocurrencies as commodities. There are currently 91 ETF rulings in progress.
- The GENIUS Act: The recent passage of this act has successfully resolved long-standing stablecoin regulatory questions regarding reserve requirements and AML compliance.
- Global Oversight: Australia passed a landmark crypto law bringing digital asset exchanges under stringent financial licensing rules, and the US CFTC has begun aggressively cracking down on prediction market insider trading.
- Institutional Moves: Traditional finance continues its march on-chain, underscored by Franklin Templeton’s acquisition of 250 Digital to launch a dedicated institutional crypto division.
Arbitrage Opportunities This Week
For algorithmic traders and quantitative hedge funds, the current market structure is highly lucrative. Extreme fear creates the widest exchange spreads in months — ideal conditions for high-frequency arbitrage.
The mechanics of panic selling inherently result in fragmented liquidity. When retail investors rush for the exits simultaneously, order books across different exchanges clear at varying rates, leading to pronounced price discrepancies. During the volatile sessions of April 2 and April 3, cross-exchange BTC and ETH spreads widened dramatically, creating momentary but highly profitable risk-free execution windows.
Furthermore, funding rates across major perpetual futures pairs have turned deeply negative. The market is aggressively crowded on the short side. For sophisticated actors, this presents complex funding rate arbitrage opportunities (e.g., spot-futures basis trades) and the elevated risk of violent short squeezes.
The DeFi landscape is also ripe for exploitation. The $285M Drift Protocol exploit temporarily shook confidence in USDC, causing minor de-pegs across decentralized exchanges. This generated rapid USDC/USDT spread opportunities. Additionally, as liquidity rebalances across protocols post-hack, yield arbitrage gaps are emerging between lending pools.
Finally, the massive momentum in the AI token sector (TAO, FET, RENDER) is fragmenting liquidity across various L1s and DEXs, resulting in cross-chain arbitrage windows that human traders simply cannot execute fast enough to capture.
This is where NeuralArB’s AI algorithms excel. Designed specifically for high-volatility, high-fear environments, our proprietary engine dynamically scans 240+ exchanges to execute cross-market trades. Historical platform data confirms a powerful correlation: NeuralArB identifies 3 to 5 times more actionable arbitrage opportunities when the Fear & Greed Index drops below 20.
To understand how macroeconomic shocks impact algorithmic execution, read our deep-dive analysis: How US Tariffs Shocked Crypto Prices. To leverage these market dislocations, explore the NeuralArB Platform.
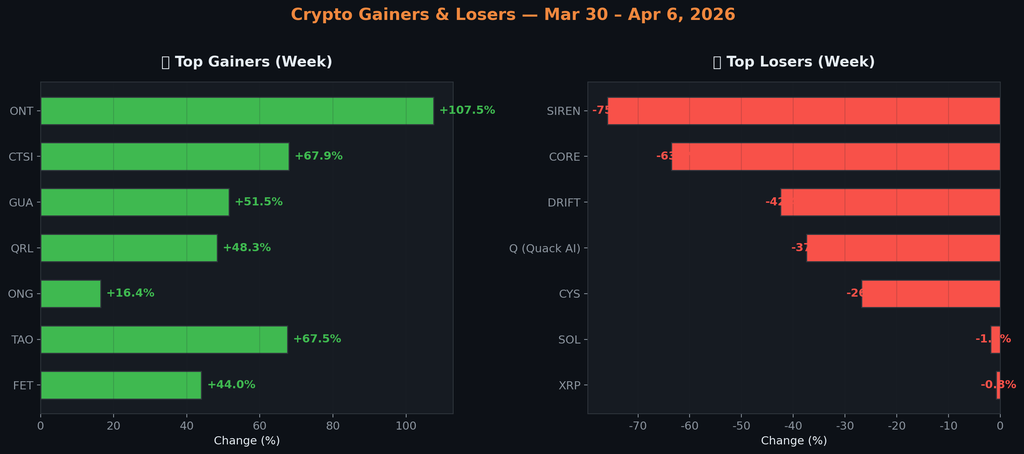
Top Gainers & Losers — Mar 30 to Apr 6, 2026
| TOP 5 GAINERS 🚀 | TOP 5 LOSERS 📉 | ||
|---|---|---|---|
| Ontology (ONT) | +107.50% | Siren (SIREN) | -75.91% |
| Cartesi (CTSI) | +67.92% | Core (CORE) | -63.51% |
| Superfortune (GUA) | +51.52% | Drift Protocol (DRIFT) | -42.44% |
| Quantum Resistant Ledger (QRL) | +48.33% | Quack AI (Q) | -37.43% |
| Ontology Gas (ONG) | +16.38% | Cysic (CYS) | -26.76% |
Access the complete, granular dataset utilized in this week’s market report, including OHLCV data, cross-exchange spread logs, and ETF flow metrics.
Key Events to Watch — Week of April 7–13, 2026
As we navigate into the second week of April, traders should prepare for significant catalyst-driven volatility. Monitor the following key events:
- CLARITY Act Senate Banking Committee Markup (mid-April): Any positive progress could define crypto regulation for years and trigger institutional spot buying.
- CPI Data Release: The single most important macroeconomic data point determining the probability of a 2026 Federal Reserve rate cut.
- Paris Blockchain Week (April 15-16): A focal point for the industry where major institutional and protocol-level announcements are frequently timed.
- Ethereum Glamsterdam Upgrade Updates: The market is looking for firm timeline commitments. Watch for the historical 4-6 week pre-event rally setup to initiate.
- Oil Prices & Strait of Hormuz: Geopolitical escalations affecting energy prices remain the primary exogenous macro driver for digital asset liquidity.
- SCOTUS Tariff Ruling: This decision could drop any day, acting as a major binary risk-on or risk-off trigger for the dollar and, inversely, Bitcoin.
- Bitcoin ETF Weekly Flows: Will the $1.32B positive momentum from March carry through the geopolitical fear of early April?
- NFP Follow-up Data: Any signs of labor market softening will be aggressively bid by the market as a rate cut catalyst.
💬 Frequently Asked Questions (FAQ)
Why is the crypto market down in April 2026?
The crypto market faces a rare convergence of headwinds in April 2026: the US-Iran military conflict has pushed oil above $106/barrel, feeding inflation expectations and delaying Federal Reserve rate cuts. Simultaneously, Trump’s 15% global tariff has created macro uncertainty. Bitcoin closed Q1 with five consecutive red monthly candles, a streak not seen since the 2018-19 bear market. Despite this, institutional accumulation via ETFs is accelerating, suggesting the selling pressure is retail-driven rather than a structural collapse.
What is the Bitcoin Fear and Greed Index today?
As of April 6, 2026, the Crypto Fear & Greed Index reads 13 — firmly in “Extreme Fear” territory. The index has been below 20 for 46 consecutive days, surpassing the fear levels seen during the FTX collapse (2022), the Terra/Luna implosion, and the COVID crash of March 2020. Historically, sustained extreme fear readings of this duration have preceded significant market recoveries.
Will Bitcoin reach $100,000 in 2026?
Prediction markets currently put the probability of Bitcoin hitting $100,000 by June 30, 2026 at effectively 0%. Bitcoin is ~45% below that target at ~$69,000. However, the medium-term catalyst roadmap is compelling: potential Fed rate cuts in September/December 2026, continued ETF inflows ($1.32B in March alone), de-escalation of US-Iran tensions, and Bitcoin’s historical post-halving trajectory. Most analysts believe $100K is achievable in H2 2026 if macro conditions improve.
What caused the Drift Protocol hack?
On April 1, 2026, approximately $285 million in USDC was drained from Drift Protocol’s vault by an attacker. This represents the largest single DeFi exploit of 2026. Circle, the issuer of USDC, faced criticism for allegedly failing to act promptly to freeze the stolen funds. The incident exposed a fundamental tension in DeFi: decentralized systems with centralized chokepoints. Drift Protocol’s native token (DRIFT) collapsed -42.44% in the aftermath.
Are AI crypto tokens a good investment in 2026?
AI tokens are the only crypto sector showing sustained positive momentum in April 2026. Bittensor (TAO) is up 67.5% over 30 days, Fetch.ai (FET) +44%, and Render (RENDER) +21%. This outperformance reflects genuine on-chain utility growth, Solana’s DEX volume nearly doubled to $87.8B weekly between August 2025 and March 2026. As with any crypto investment, position sizing, risk management, and diversification are essential. NeuralArB’s AI token analysis tools can help identify entry and exit signals.
How do Trump tariffs affect cryptocurrency prices?
Trump’s tariff policy creates a negative feedback loop for crypto. Higher tariffs → inflation expectations rise → Fed delays rate cuts → risk assets including crypto sell off. The current 15% global tariff (up from a baseline of ~2%) pushed the average effective US tariff rate to 10.3%, a multi-decade high. Bitcoin’s immediate reaction to tariff news has been bearish, though it has shown relative resilience vs. equities, holding near $68K while the S&P sold off more severely. For deeper analysis, see our article: How US Tariffs Shocked Crypto Prices.
What is the CLARITY Act and how does it impact crypto?
The CLARITY Act (Crypto Legislative and Regulatory Intelligence Technology Yield Act) is the most significant piece of US crypto legislation currently advancing through Congress. It would clearly delineate which digital assets are commodities (CFTC jurisdiction) vs. securities (SEC jurisdiction), provide a registration framework for crypto exchanges, and establish rules for DeFi protocols. As of April 2026, the Senate Banking Committee is advancing the markup. Passage would likely be a major positive catalyst — historical precedent suggests regulatory clarity drives institutional adoption.
Should I buy Bitcoin during extreme fear?
Historically, Bitcoin’s best buying opportunities have come during extreme fear periods. The Fear & Greed Index currently reads 13 — below FTX collapse and COVID crash levels. Warren Buffett’s principle of “being greedy when others are fearful” applies to Bitcoin’s historical cycle data. However, macro headwinds (war, tariffs, delayed rate cuts) are genuine. A prudent approach: dollar cost averaging into Bitcoin over weeks/months during extreme fear, rather than deploying all capital at once. Never invest more than you can afford to lose.
What are the best crypto arbitrage opportunities this week?
The extreme fear environment (Fear & Greed: 13) is creating exceptional arbitrage conditions:
1) Cross-exchange BTC/ETH spread discrepancies are at their widest in months;
2) Funding rates turned deeply negative, creating funding rate arbitrage opportunities;
3) USDC/USDT spreads widened post-Drift exploit;
4) AI tokens (TAO, FET) show fragmented DEX liquidity across chains.
NeuralArB’s platform is engineered specifically for these high-volatility environments — our AI detects 3-5x more arbitrage opportunities when the Fear & Greed Index is below 20.
When will the Fed cut interest rates in 2026?
The March NFP print of 228,000 (vs. 185,000 consensus) pushed the first Fed rate cut timeline further back. Current market pricing puts September 2026 as the earliest likely cut, with December 2026 as the base case. A stronger than expected jobs market, combined with oil-driven inflation from the US-Iran conflict, gives the Fed little room to ease. A SCOTUS ruling against Trump’s tariffs (which could drop any day) or a geopolitical ceasefire would likely accelerate the rate cut timeline.
Turn Market Chaos Into Algorithmic Opportunity
Extreme fear is the algorithmic trader’s best friend. While retail investors panic sell and market headlines scream crisis, NeuralArB’s AI-powered arbitrage engine is quietly identifying spread opportunities across 240+ exchanges – 24/7, automatically.
This week alone, extreme fear conditions (Fear & Greed: 13) generated 3-5x the normal arbitrage signal volume on the NeuralArB platform. Cross-exchange spreads on BTC and ETH are at their widest in months. Funding rates have flipped negative – a classic setup for squeeze plays. Post-Drift exploit stablecoin spreads created fleeting but significant USDC/USDT windows. The market’s fear is the algorithm’s fuel.
 Stay Connected:
 Related Analysis:
How High-Frequency Trading (HFT) (Impacts Crypto Arbitrage)
- Reinforcement Learning in Dynamic Markets (AI trading strategies)
- Crypto Arbitrage 101 (beginner’s guide to arbitrage)
Data Sources:
- CoinGecko – Real-time price data and market cap
- Yahoo Finance – Historical price data
- CoinDesk – Liquidation data
- Reuters – Market analysis
- Binance – Upcoming catalysts
Disclaimer: This analysis is for educational purposes. Arbitrage trading involves substantial risk, including custody risk, regulatory risk, and execution risk. Past performance is not indicative of future results. Never risk capital you cannot afford to lose. Consult qualified financial and legal advisors before trading.