

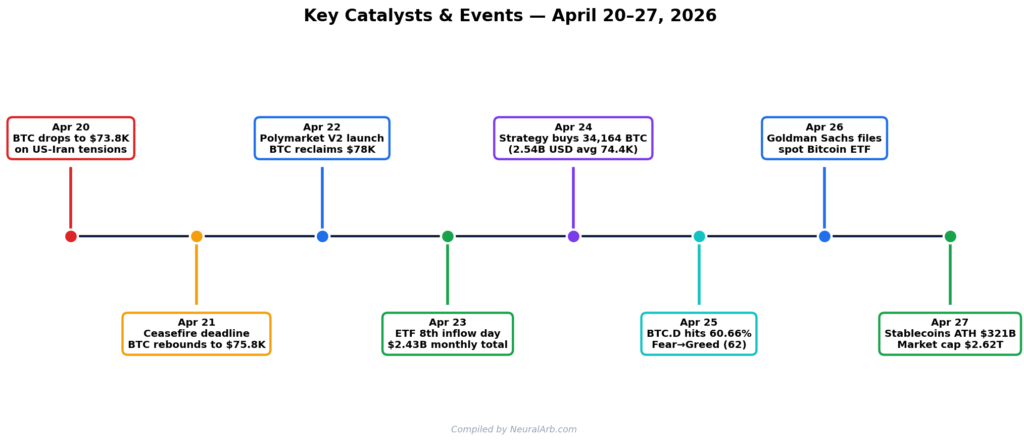
📌 TL;DR — The Week in 60 Seconds
- Bitcoin climbed from $73,801 → $78,420 (+3.8%) after a US–Iran scare bottomed early Monday.
- ETF demand was the dominant force: 8 straight days of net inflows totaling ~$2.43B for April, with BlackRock’s IBIT capturing ~75% of flows.
- BTC dominance hit 60.66% on April 25 — the highest reading of 2026 — confirming an ongoing “Bitcoin season.”
- Strategy bought 34,164 BTC for $2.54B at an average $74,395/coin, lifting holdings to 815,061 BTC.
- Sentiment flipped hard: Fear & Greed Index moved from 29 (Fear) to 62 (Greed).
- Stablecoin supply hit a record $321B, signaling deep on-chain liquidity for the next leg.
1. Market Snapshot at a Glance
The week of April 20–27, 2026 began on shaky footing as the two-week U.S.–Iran ceasefire approached its expiry, briefly sending Bitcoin to $73,801 on Monday morning. By Friday, however, headline-driven volatility had given way to one of the strongest institutional demand prints of the year. Bitcoin closed the week at $78,420, Ethereum reclaimed the $2,360 handle, and BTC dominance broke 60% for the first time in 2026 — a level it had not seen since 2021.
Bitcoin (BTC)
$78,420
+3.8% WoW
Ethereum (ETH)
$2,362
+2.9% WoW
BTC Dominance
60.40%
+0.6 pp
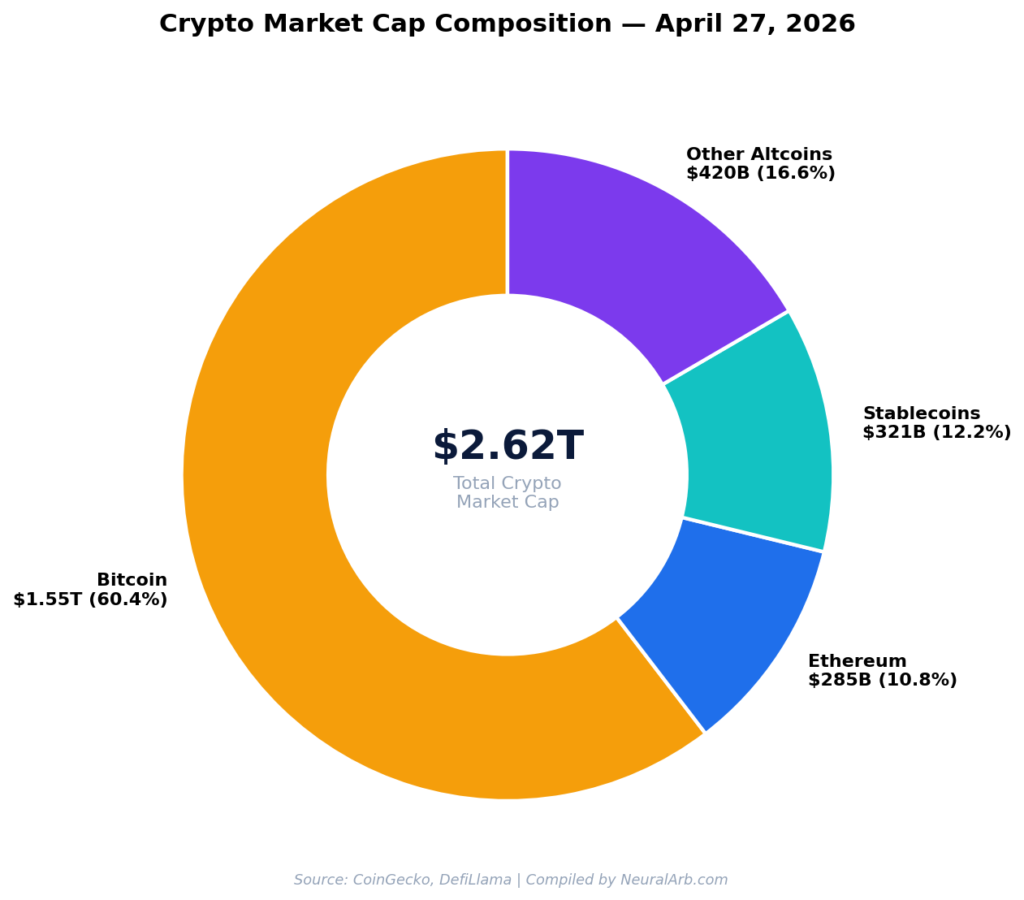
Total Market Cap
$2.62T
+4.1% WoW
April ETF Inflows
$2.43B
8-day streak
Fear & Greed
62
Greed (was 29)
2. Bitcoin & Ethereum Price Action
Bitcoin’s intraweek path was a clean V-shape. After the Monday open at $73,801 — driven by news that the Strait of Hormuz had been temporarily closed amid renewed Iran-related tensions — buyers stepped in aggressively as commercial shipping resumed. By April 22, BTC had pierced $78,000, and from there it consolidated in a tight $77.9K–$78.5K range for the remainder of the week. [Fortune]
Ethereum tracked the same recovery but lagged on a relative basis. ETH printed a Monday low of $2,263 before grinding higher to $2,362 by Friday — a respectable +2.9% week, but materially behind Bitcoin’s +3.8%. The ETH/BTC ratio compressed further, a recurring pattern in Bitcoin-dominant phases.
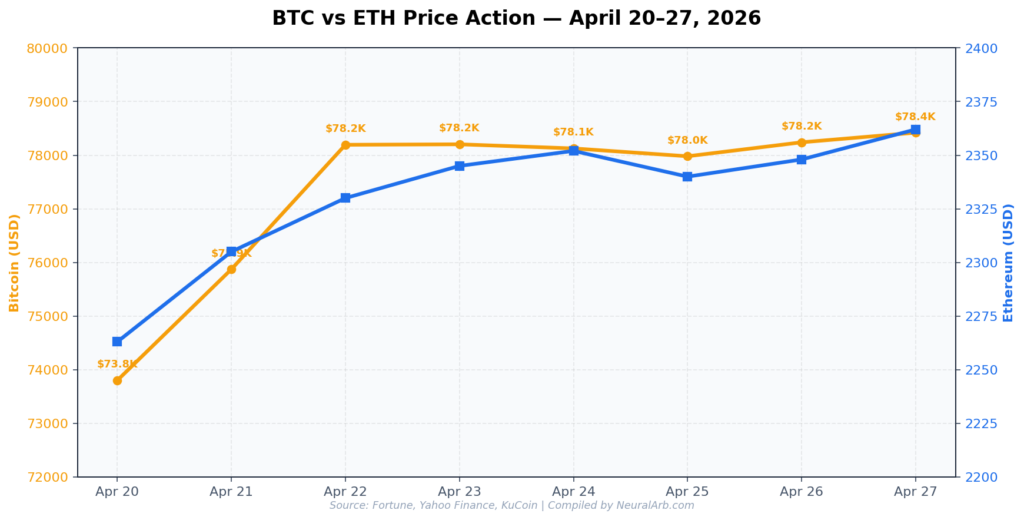
Trader takeaway: The $75,000 level — the Monday-Tuesday inflection point — is now the line in the sand bulls must defend. Lose it, and analyst Michael van de Poppe’s $86K target gets pushed out by weeks. Hold it, and the path of least resistance points to the prior $80K psychological resistance. [MSN/Cointelegraph]
Daily price table — April 20-27, 2026
| Date | BTC (USD) | ETH (USD) | XRP | SOL | BTC.D | F&G |
|---|---|---|---|---|---|---|
| Apr 20 | $73,801 | $2,263 | $1.425 | $128.5 | 59.80% | 29 Fear |
| Apr 21 | $75,872 | $2,305 | $1.432 | $132.4 | 59.90% | 35 Fear |
| Apr 22 | $78,194 | $2,330 | $1.430 | $135.8 | 60.10% | 48 Neutral |
| Apr 23 | $78,203 | $2,345 | $1.440 | $137.1 | 60.30% | 55 Greed |
| Apr 24 | $78,126 | $2,352 | $1.435 | $136.5 | 60.50% | 60 Greed |
| Apr 25 | $77,980 | $2,340 | $1.430 | $135.9 | 60.66% | 62 Greed |
| Apr 26 | $78,240 | $2,348 | $1.438 | $137.4 | 60.55% | 61 Greed |
| Apr 27 | $78,420 | $2,362 | $1.442 | $138.6 | 60.40% | 60 Greed |
3. Bitcoin Dominance & the Altcoin Question
The headline structural development of the week was Bitcoin dominance crossing 60% on April 22 and peaking at 60.66% on April 25 — the first time in 2026. For context, BTC.D averaged 45.6% in 2023, 51.9% in 2024 and 59.3% in 2025; the breach of 60% in this cycle marks the highest dominance reading since the deep crypto winter of late 2021. [BYDFi]
Translation for portfolio managers: capital is concentrating in the asset with the deepest liquidity and the cleanest institutional wrapper (spot ETFs). The Altcoin Season Index sat below 40 throughout the week, well under the 75 threshold typically required to confirm a true altseason. Most altcoins are still beta-trading Bitcoin rather than establishing independent narratives.
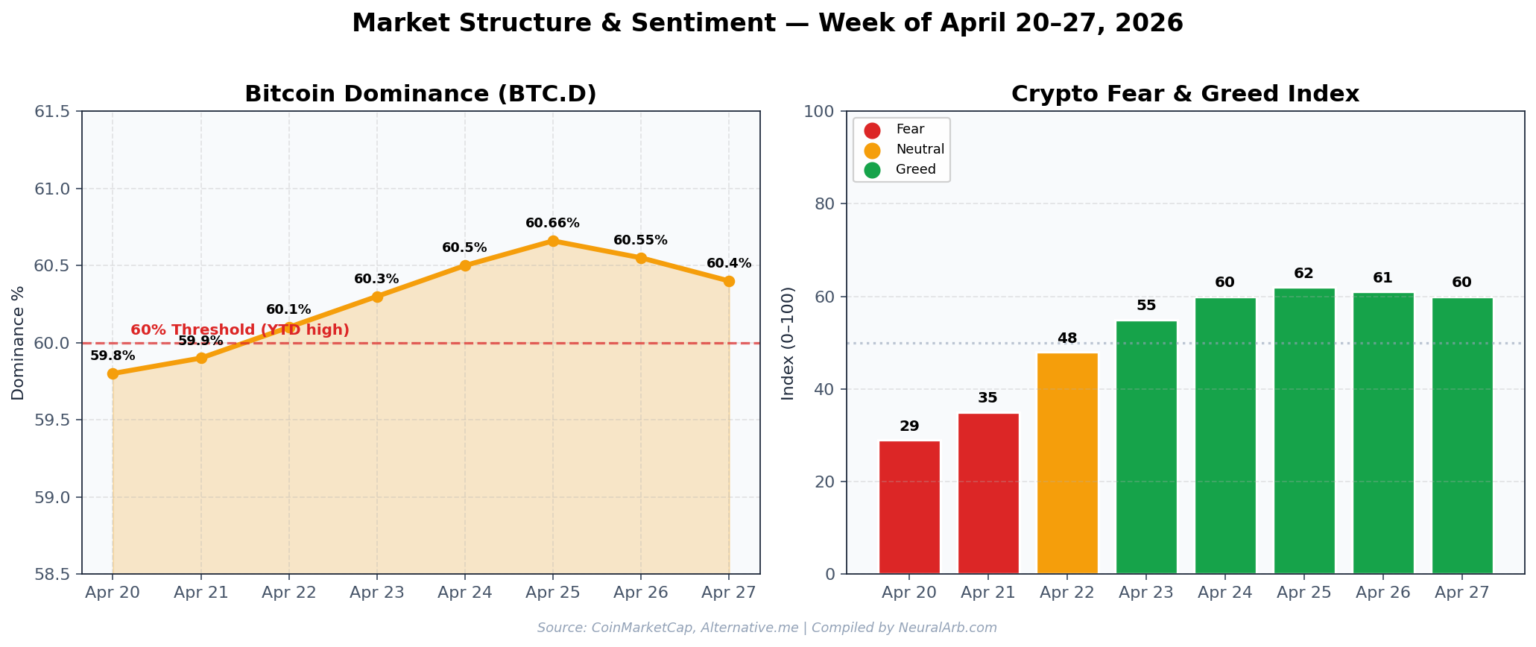
What this means for portfolio construction
Historically, dominance peaks above 60% have preceded eventual altcoin rotations — but only after a clear topping pattern. We are not there yet. For now, the cleanest expression of the bullish thesis is BTC core exposure, complemented by selective high-conviction altcoin positions tied to discrete catalysts (RWA, AI compute, institutional product launches).
4. Spot ETF Flows & Institutional Accumulation
If one chart explains the week, it’s this one. U.S. spot Bitcoin ETFs notched their eighth consecutive day of net inflows through April 23, totaling roughly $2.43 billion for April alone — nearly double March’s $1.32B. Those eight days absorbed approximately 19,000 BTC, equal to nine times the amount Bitcoin miners produced over the same period. [Source]
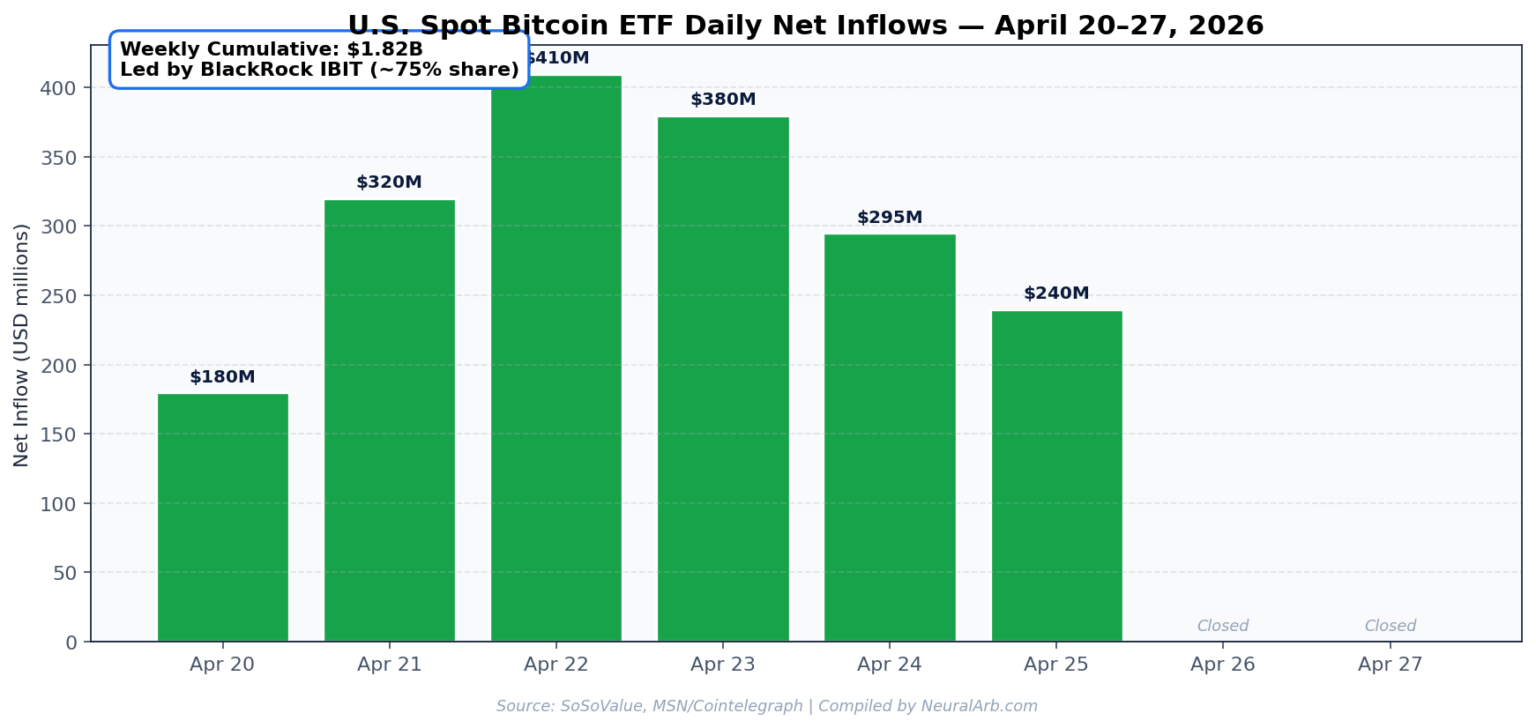
Where the money went
- BlackRock IBIT — Captured ~75% of all flows on April 23. YTD inflows now exceed $3B; IBIT holdings surpass 806,700 BTC, about 3.8% of Bitcoin’s total supply.
- Strategy (formerly MicroStrategy) — Disclosed a $2.54B purchase of 34,164 BTC at an average $74,395, taking total holdings to 815,061 BTC.
- BitMine Immersion — Added 101,627 ETH in its largest accumulation since December — a multi-week pattern at the corporate-treasury layer.
- Goldman Sachs — Filed for its first spot Bitcoin ETF with the SEC, joining the institutional ETF wave. [Kelman PLLC]
“Cumulative lifetime inflows into U.S. spot Bitcoin ETFs now stand at $58.55 billion. The concentration of supply in a small number of large funds is reducing Bitcoin’s effective free float — and that mechanically amplifies price impact on any subsequent demand surge.”
5. Altcoin Winners and Losers
Despite Bitcoin season, several altcoins outperformed the index — almost entirely on idiosyncratic catalysts rather than broad sector strength.
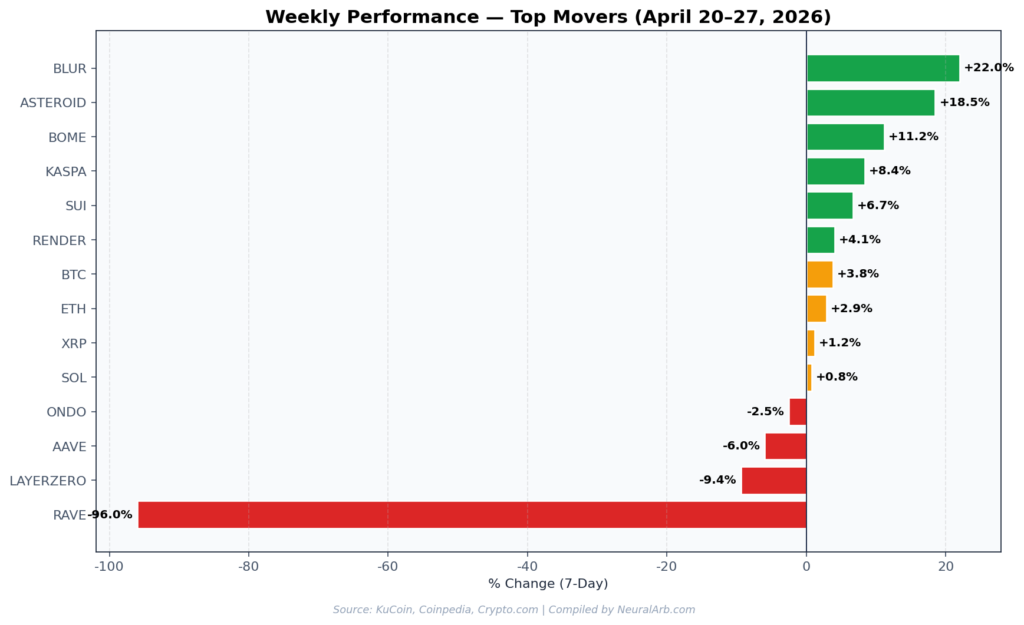
Top gainers — what drove them
- +22% BLUR: Surged on news that NFT marketplace Foundation will shut down permanently, reshuffling the NFT trading landscape.
- +18.5% ASTEROID: Elon Musk publicly endorsed Asteroid as a SpaceX mascot; the meme cap briefly cleared $200M.
- +11.2% BOME / NEIRO / PNUT: Chinese-meme rotation hit fresh highs as Binance-listed momentum tokens rallied together.
- +8.4% KASPA: VIP sponsorship of the Hong Kong Web3 Festival plus an imminent Toccata testnet restart for the Covenants++ upgrade. [Coinpedia]
- +6.7% SUI: CME Group announced May 4 SUI futures launch; 21Shares SUI ETF already live on Nasdaq.
- +4.1% RENDER (RNDR): RenderCon 2026 wrapped in Hollywood with NVIDIA, WME and Stability AI keynotes; AI workloads now 35–40% of network usage.
Notable losers
- -96% RAVE: Multiple exchanges and on-chain analysts opened price-manipulation investigations — a textbook fraud blow-up.
- –9.4% LayerZero (ZRO): A 25.7M-token unlock (2.4% of supply) hit on April 20.
- -6% AAVE: Bad debt from a KelpDAO exploit triggered ~$6.6B in capital outflows; utilization briefly spiked to 100%.
6. Stablecoins, DeFi & On-Chain Liquidity
The stablecoin sector quietly hit a fresh record. Total stablecoin market cap topped $321 billion by week’s end — a new all-time high — driven primarily by USDT, USDC and the rapid growth of yield-bearing variants. France stepped up its rhetoric on euro-denominated stablecoins, while the Bank for International Settlements (BIS) called for coordinated international oversight. [Bitcoin.com]
On the DeFi side, total value locked (TVL) sits at roughly $91.6 billion, with Aave navigating the KelpDAO exploit fallout. Ethereum itself processed over 200 million transactions in Q1 2026 — an all-time quarterly high — confirming the network’s continued role as settlement infrastructure for tokenized assets and stablecoin flows.
7. Regulation & Macro Catalysts
Six regulatory developments shaped the week, with the net signal trending bullish for institutional adoption:
| Event | Impact |
|---|---|
| Goldman Sachs files for spot Bitcoin ETF | Bullish Accelerates institutional integration |
| NY Attorney General sues Coinbase & Gemini over event-contract platforms | Bearish for prediction markets; sets up state-vs-federal jurisdictional fight |
| BIS calls for global stablecoin coordination | Neutral — long-term structural positive, short-term overhang |
| France pushes euro-denominated stablecoins | Bullish for non-USD stablecoin issuers |
| Pakistan opens banking rails to licensed VASPs | Bullish Supervised-adoption trend continues |
| SEC accepts NYSE tokenized-securities proposal | Bullish for RWA narrative (Ondo, Franklin Templeton) |
On macro, the U.S.–Iran ceasefire deadline (April 21) was the dominant variable. Oil swung in 8% intraday ranges, U.S. equity futures whipsawed, and Bitcoin behaved like a high-beta risk asset on Monday before re-establishing its institutional bid by midweek. Tesla earnings (April 23) and the U.S. S&P Global PMI flash (April 23) were secondary inputs. [KuCoin Daily]
8. Outlook for the Week of April 27 – May 4
Three things to watch
- $80K resistance test. If ETF inflows extend to a 9th–10th day this week, BTC has a credible shot at clearing $80,000. Failure to break decisively risks a deeper consolidation toward $74K–$75K.
- BTC dominance ceiling. 60.7% has been a supply zone in prior cycles. A rejection here is the most plausible setup for a 30–60% rotation into mid-cap altcoins, per Michael van de Poppe.
- CME SUI futures launch (May 4). The first new institutional altcoin product since the SOL/XRP wave; flows in the first 48 hours will be a leading indicator for the next altcoin cohort.
Neural Arb base case: Bullish into mid-May. Spot ETF demand is structurally strong, sentiment is greedy but not euphoric (62, not 85+), and macro risk has compressed materially. Tactical positioning: long BTC core, selective exposure to RWA (Ondo) and AI-compute (Render, Bittensor), avoid recently-unlocked tokens (LayerZero) until supply is absorbed.
9. Download the Data & Charts
📥 Free downloads — research-grade dataset
Use these resources for your own modeling, presentations, or newsletters. Data sourced from KuCoin, Fortune, Yahoo Finance, MSN/Cointelegraph, Coinpedia and DefiLlama; compiled by NeuralArB.
The Excel workbook contains: Daily Prices, Weekly Summary, Key Events, and Top Movers.
💬 Frequently Asked Questions (FAQ)
What was Bitcoin's price during April 20-27, 2026?
Bitcoin opened the week at $73,801 on April 20 after a US–Iran-driven dip, rallied through the week, and closed near $78,420 on April 27 — a weekly gain of approximately 3.8%. The intra-week peak was $78,554 on April 24.
How much did spot Bitcoin ETFs receive in inflows?
U.S. spot Bitcoin ETFs logged eight consecutive days of net inflows through April 23, contributing to a ~$2.43 billion April total — nearly double March’s $1.32B. BlackRock’s IBIT alone captured around 75% of flows on April 23, and lifetime cumulative inflows now stand at $58.55B.
Why did Bitcoin dominance hit 60.66% — and what does it mean?
BTC.D crossed 60% for the first time in 2026 on April 22 and peaked at 60.66% on April 25. It signals capital is concentrating in Bitcoin (especially via spot ETFs) rather than rotating into altcoins. Historically, dominance peaks above 60% have preceded eventual altcoin-season rotations — but typically only after a clear topping pattern, which has not yet formed.
What was Strategy's (MicroStrategy's) Bitcoin purchase this week?
Strategy disclosed the acquisition of 34,164 BTC for approximately $2.54 billion at an average price of $74,395 per coin. Total corporate treasury holdings now stand at 815,061 BTC, cementing Strategy as the largest institutional Bitcoin holder in the world.
Did sentiment change during the week?
Dramatically. The Crypto Fear & Greed Index moved from 29 (Fear) on Monday April 20 to 62 (Greed) by Friday April 25. That 33-point swing in five sessions is one of the sharpest sentiment reversals of 2026 and reflects the combination of easing geopolitical risk, ETF inflow acceleration, and Strategy’s accumulation disclosure.
Which altcoins outperformed Bitcoin this week?
The clearest outperformers were BLUR (+22%), ASTEROID (+18.5%), BOME (Chinese-meme rotation), KASPA (+8.4%), SUI (+6.7%) and RENDER (+4.1%). Each rose on a specific catalyst (event, listing, partnership, upgrade) rather than broad-based altcoin demand.
What happened with the AAVE / KelpDAO exploit?
A KelpDAO exploit created bad debt that propagated into Aave, prompting users to withdraw approximately $6.6 billion in ETH. Utilization briefly hit 100%, and AAVE token fell ~6% on the week. The protocol absorbed the impact, but the event highlighted contagion risk between staking-derivative protocols and major lenders.
What major regulatory actions occurred?
Six notable items:
1) Goldman Sachs filed for a spot Bitcoin ETF,
2) the NY Attorney General sued Coinbase & Gemini over prediction markets,
3) the BIS called for coordinated global stablecoin oversight,
4) France advocated euro-backed stablecoins,
5) Pakistan opened banking access to licensed virtual-asset service providers,
6) the SEC accepted a NYSE tokenized-securities proposal.
What's the outlook for next week (April 27 – May 4)?
NeuralArB’s base case is bullish into mid-May, contingent on Bitcoin holding above $75,000 and ETF inflows extending the streak. Key levels: $80K resistance overhead, $75K support below. Watch the May 4 CME SUI futures launch as a leading indicator of the next altcoin rotation cohort.
Where is the data sourced from?
All price and flow data is aggregated from Fortune, Yahoo Finance, KuCoin Research, CoinGecko, DefiLlama, SoSoValue, and reporting from MSN/Cointelegraph and Coinpedia. Compilation, interpretation and chart construction by NeuralArB Research.
🤖 Want AI-powered crypto arbitrage that works 24/7?
Neural Arb’s algorithmic engine identifies and executes cross-exchange and cross-protocol arbitrage opportunities — even while you sleep.
 Stay Connected:
 Related Analysis:
How High-Frequency Trading (HFT) (Impacts Crypto Arbitrage)
- Reinforcement Learning in Dynamic Markets (AI trading strategies)
- Crypto Arbitrage 101 (beginner’s guide to arbitrage)
Data Sources:
- CoinGecko – Real-time price data and market cap
- Yahoo Finance – Historical price data
- CoinDesk – Liquidation data
- Reuters – Market analysis
- Binance – Upcoming catalysts
Disclaimer: This analysis is for educational purposes. Arbitrage trading involves substantial risk, including custody risk, regulatory risk, and execution risk. Past performance is not indicative of future results. Never risk capital you cannot afford to lose. Consult qualified financial and legal advisors before trading.