

🚨 Executive Summary: Key Market Movements
- Bitcoin (BTC): Crashed from ~$68,000 to a low of $64,416 before stabilizing near $65,000.
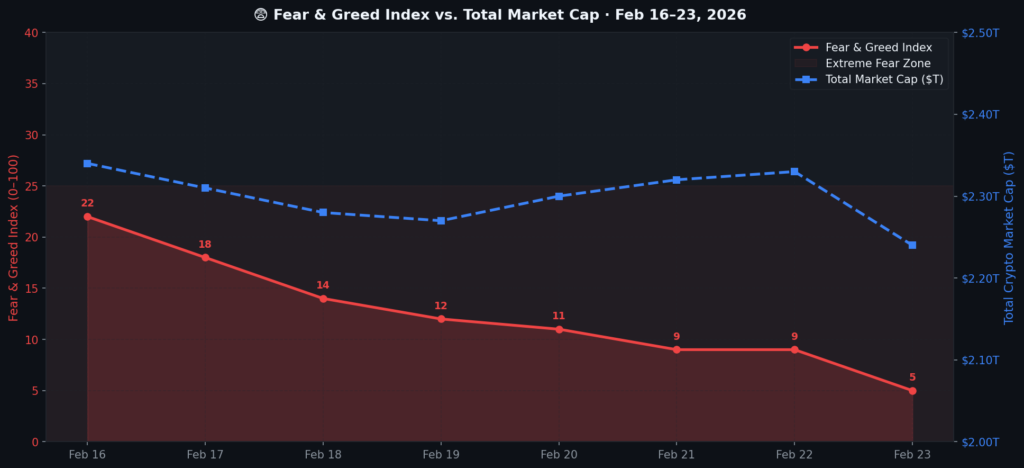
- Market Sentiment: Fear & Greed Index plummeted to 5/100 (Extreme Fear), a historic low not seen since 2018.
- Policy Shock: Supreme Court struck down Trump tariffs (6-3 vote), triggering immediate market uncertainty.
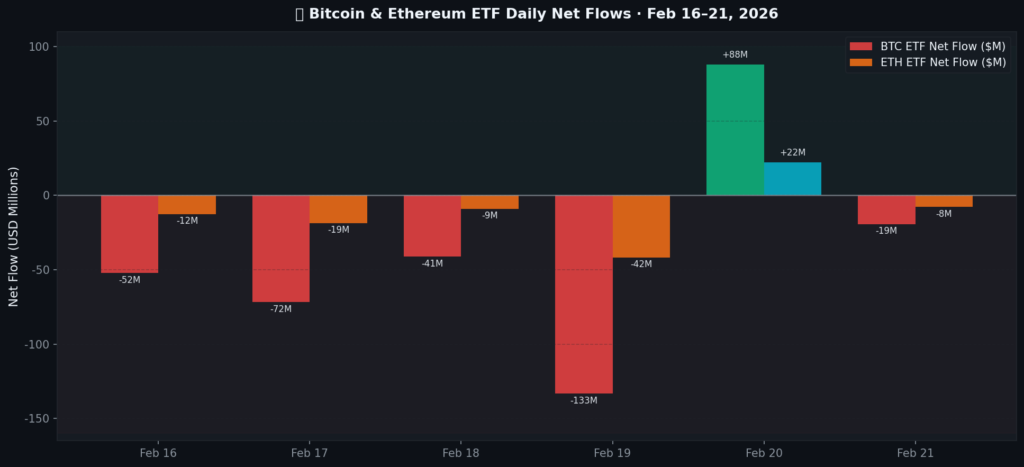
- Institutional Flows: Bitcoin ETFs recorded a 5-week outflow streak totaling $3.8B, though Feb 20 saw a rare reversal of +$88.1M.
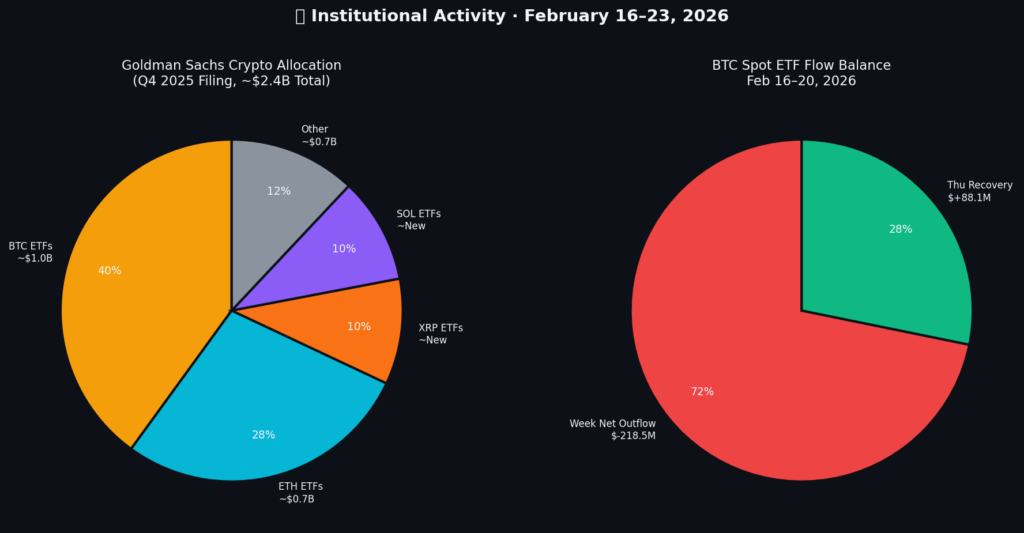
- Major Players: Goldman Sachs reduced BTC ETF holdings by 39.4% but initiated new positions in XRP and SOL.
- Altcoin Divergence: While majors bled, BERA (+57%) and MON (+35%) posted significant gains.
1. Executive Summary
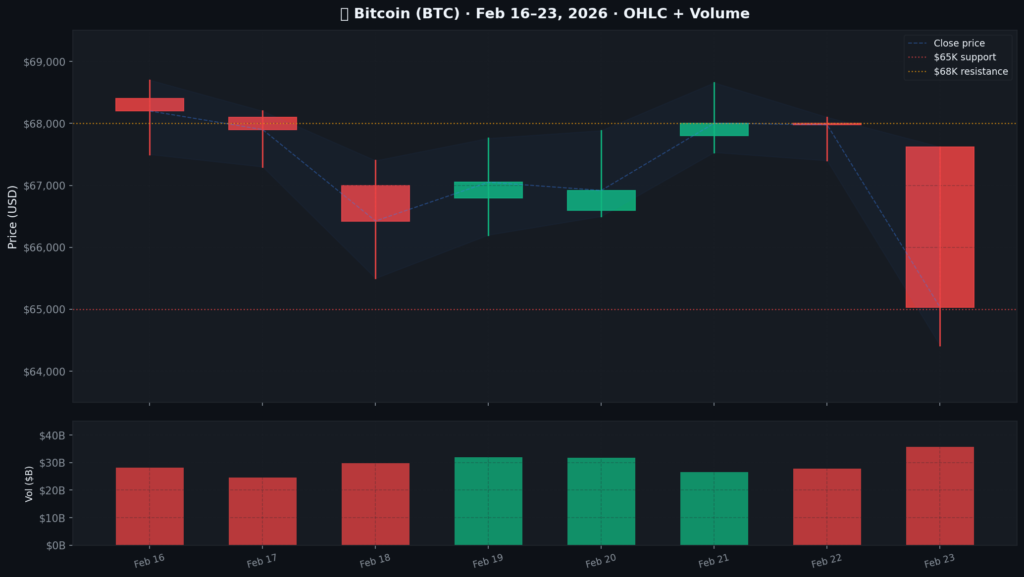
The week of February 16–23, 2026, will be remembered as a pivotal moment of capitulation and extreme volatility in the cryptocurrency markets. Bitcoin (BTC), the market leader, fell from a weekly opening near $68,000 to a low of $64,400, closing the week in the $65,033–$65,757 range. This marks the fifth consecutive month of decline for the asset, which is now down approximately 25% year to date.
The primary catalyst for the late week volatility was the United States Supreme Court’s decisive 6-3 ruling striking down President Trump’s controversial tariffs. While initially expected to be a stabilizing factor for global trade, the immediate aftermath created a vacuum of uncertainty that rattled risk assets. The crypto market reacted violently, with over $468–$500 million in liquidations recorded in a 24 hour window on February 23.
Investor sentiment has collapsed to historic lows. The Crypto Fear & Greed Index dropped to 5/100, indicating Extreme Fear. This level has not been consistently seen since the 2018 bear market bottom, suggesting a potential capitulation event. Despite the fear, institutional activity presents a mixed picture: Bitcoin ETFs have seen a 5-week outflow streak totaling $3.8 billion, yet February 20 marked a notable reversal with $88.1 million in net inflows.
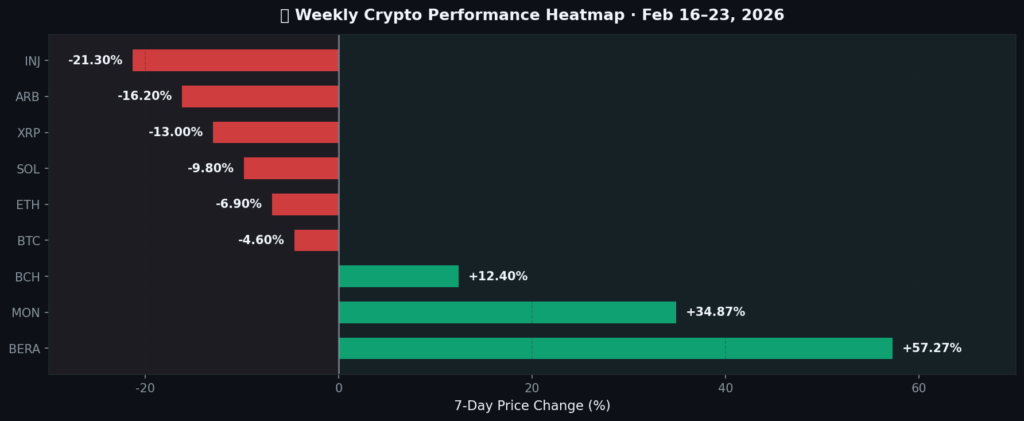
The total cryptocurrency market capitalization currently sits between $2.30 trillion and $2.33 trillion. Ethereum struggled to hold the psychological $2,000 level, dropping to the $1,860–$1,980 range. However, the altcoin market showed remarkable divergence, with newer tokens like Berachain (BERA) and Monad (MON) surging 57% and 35% respectively, defying the broader downtrend.
🤖 AI-Powered Trading Advantage
2. Bitcoin Price Action (Feb 16-23)
Bitcoin’s price action this week was characterized by a slow bleed followed by a sharp capitulation event. The week opened on February 16 with BTC hovering around the $68,000 level, already weakened by four consecutive weeks of losses. Market participants were hesitant, awaiting clarity on US trade policy and Federal Reserve minutes.
Detailed Breakdown
February 16-18: Bitcoin traded in a tight consolidation range between $67,500 and $68,200. Volumes were relatively low as the market digested macroeconomic data. Bloomberg reported that this marked the fourth straight week of losses, setting a bearish tone.
February 19-20: Volatility began to increase. On the 19th, Bitcoin ETFs saw significant outflows of $133.3 million, pushing prices lower to test the $66,400 support. However, February 20 saw a brief respite with a recovery to the $67,000–$68,000 range, supported by a surprise $88.1 million net inflow into spot ETFs, led by BlackRock’s IBIT.
February 21-22: The weekend saw choppy trading around $67,900, but the underlying weakness was evident. The Fear & Greed index hovered around 9/100, signaling deep-seated anxiety among retail traders.
February 23 (The Crash): The Supreme Court ruling acted as a trigger event. Bitcoin plunged sharply, breaking key technical support at $66,000 and cascading down to a low of $64,416. A single whale liquidation of $61 million on the HTX exchange exacerbated the sell-off. By the daily close, BTC had recovered slightly to the $65,000 level but remained fragile.
Expert Commentary
“While the current price action is undeniably bearish, our production cost model suggests a hard floor at $77,000 for miners remains a critical long term reference, though current spot prices have deviated below this due to capitulation.” — JPMorgan Analysts
Despite the weakest bear case in history narrative, analysts at Bernstein maintained their $150,000 price target for 2026, arguing that the structural fundamentals remain intact. Conversely, Grayscale released a report suggesting that Bitcoin has temporarily lost its “digital gold” narrative and is currently trading with a high correlation to speculative tech stocks, making it vulnerable to broader equity market jitters.
3. Ethereum & Major Altcoins Performance
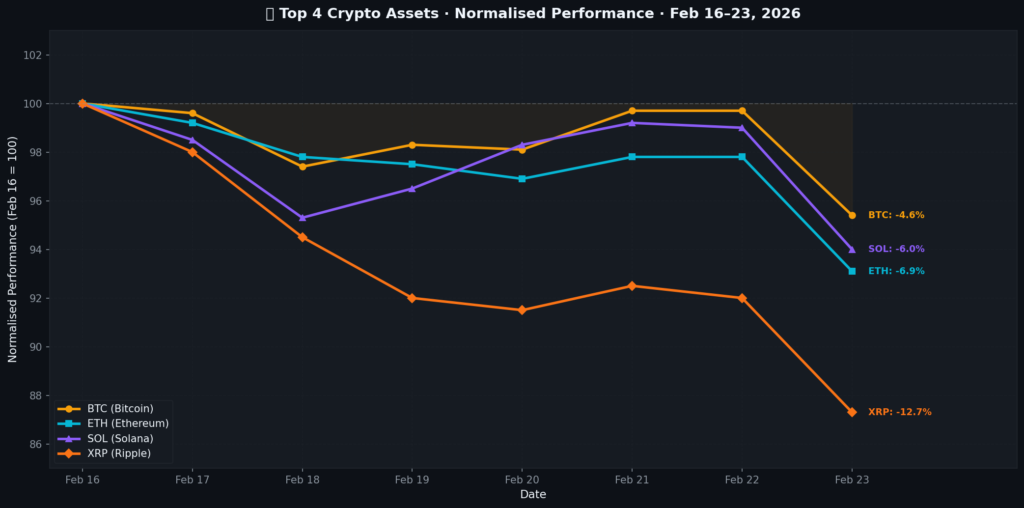
The altcoin market experienced a bifurcated reality this week. While legacy altcoins like Ethereum (ETH) and XRP suffered heavy losses, a new generation of tokens posted impressive gains, highlighting a rotation of capital into high beta, speculative assets.
Ethereum (ETH) Struggles at $2,000
Ethereum opened the week attempting to reclaim the $2,000 psychological resistance but failed to sustain momentum. By mid week, ETH was trading in the $1,948–$1,980 range. The February 23 crash saw ETH drop 5.72%, plummeting to $1,860. The asset is currently facing significant headwinds from regulatory uncertainty surrounding DeFi and lackluster ETF inflows compared to Bitcoin.
The Divergence: Winners vs. Losers
While the majors bled, traders sought alpha in newer ecosystems:
- Solana (SOL): Down approximately 45% from its peaks, trading in the $81–$85 range. Despite the price drop, network activity remains robust.
- XRP: One of the week’s biggest losers among majors, trading at $1.43, down 30% from its early February high of $2.05.
- Berachain (BERA): The standout performer, surging +57.27% as its mainnet launch narrative gained traction.
- Monad (MON): Another high performance L1, gaining +34.87% amidst the broader market sell off.
4. Institutional Activity & ETF Flows
Institutional flows provided a complex signal this week, characterized by capitulation from some players and strategic accumulation by others. The overarching trend for 2026 remains negative, with Bitcoin ETFs recording $4.5 billion in year to date outflows.
ETF Flow Analysis
The spot Bitcoin ETF market extended its outflow streak to five consecutive weeks, draining $3.8 billion from the ecosystem. February 19 was particularly bearish, with $133.3 million leaving Bitcoin funds and $41.8 million exiting Ethereum funds. However, a significant reversal occurred on February 20, with $88.1 million in net inflows, suggesting that smart money may be stepping in to buy the dip at these levels.
Goldman Sachs Portfolio Shuffle
In a major disclosure, Goldman Sachs revealed significant adjustments to its digital asset portfolio for Q4. The banking giant reduced its Bitcoin ETF holdings by 39.4% and Ethereum ETF holdings by 27.2%. However, in a bullish signal for the broader ecosystem, Goldman initiated new positions in XRP and Solana (SOL) ETFs for the first time. Their total crypto exposure remains approximately $1 billion, indicating a strategy shift towards diversification rather than a complete exit.
Other Notable Institutional Moves
- BlackRock: Integrated its BUIDL tokenized fund into the Uniswap ecosystem, creating a direct bridge between traditional finance (TradFi) and decentralized finance (DeFi). This allows institutional investors to trade BUIDL against USDC 24/7.
- Strategy (MicroStrategy): Issued $7 million in perpetual preferred stock, a move designed to offer investors steady returns without the direct volatility of common shares tied to Bitcoin price action.
5. Market Sentiment Analysis
The psychological state of the market has reached a critical extreme. The Crypto Fear & Greed Index, a widely tracked metric of market emotion, plummeted to a reading of 5/100 on February 23. This level signifies “Extreme Fear” and represents a historic low not seen consistently since the depths of the 2018 bear market.
Retail vs. Institutional Sentiment
According to data from market maker Wintermute, retail attention has been in steady decline throughout 2025 and into early 2026. However, search interest for the term “Bitcoin” on Google skyrocketed this week, a classic counter indicator often seen during periods of high volatility and panic selling. Social sentiment analysis reveals a dominance of bearish narratives, with many traders calling for sub-$50k targets, often a signal that a local bottom may be forming.
6. Regulatory Developments
Regulation remains a double edged sword for the crypto industry. This week saw significant movement on key legislative pieces in the United States.
The CLARITY Act
The White House is actively pushing for the passage of the CLARITY Act, a comprehensive bill aimed at providing regulatory certainty for digital assets. Ripple CEO Brad Garlinghouse stated there is now an 80% chance the bill will pass by the end of April. SEC Chair Atkins has also publicly backed the legislation, marking a rare alignment between regulators and the executive branch.
Stablecoin Regulation
The GENIUS Act, poised to be the first major US law specifically regulating crypto, is advancing. The debate over stablecoin yields continues, with a fierce lobbying battle between the traditional banking sector and crypto native firms. Meanwhile, Hong Kong has confirmed it will begin issuing stablecoin licenses in March, potentially attracting capital fleeing US uncertainty.
Supreme Court Ruling
The most impactful event was the Supreme Court’s 6-3 decision striking down President Trump’s tariffs. While legally a check on executive power, markets interpreted the ruling as a source of immediate instability for US trade policy, prompting a risk off move that hit crypto assets hard.
7. DeFi & NFT Market Update
The Decentralized Finance (DeFi) and NFT sectors continue to evolve amidst the market downturn.
NFT Market Contraction
The NFT market has seen a severe contraction, with total market capitalization plummeting from approximately $9 billion in January 2025 to significantly lower levels today. Platform closures and reduced trading volumes indicate a major consolidation phase.
DeFi: Infrastructure over Hype
Conversely, DeFi is maturing. The narrative has shifted from speculative yield farming to building robust financial infrastructure. The integration of BlackRock’s BUIDL fund into Uniswap is a watershed moment, validating the thesis that real world assets (RWAs) will be the primary driver of the next DeFi bull run. Total Value Locked (TVL) remains depressed in dollar terms due to asset price drops, but ETH denominated TVL has shown resilience.
8. Technical Analysis & Key Levels
From a technical perspective, Bitcoin is at a precarious juncture. The loss of the $68,000 support level has opened the door to lower targets.
Bitcoin (BTC) Levels
- Immediate Support: $64,400 This week’s low and $62,000 historical volume node.
- Critical Support: $60,000 (Psychological level). A break below here could trigger a slide to $52,000.
- Resistance: $68,000 Previous support turned resistance and $72,000 Key breakdown level.
- Trend: Bearish on Daily and Weekly timeframes. RSI is oversold but not yet showing bullish divergence.
Ethereum (ETH) Levels
- Support: $1,800 is the line in the sand. A weekly close below this could see ETH revisit $1,550.
- Resistance: $2,000 and $2,150. Bulls need to reclaim $2,150 to invalidate the current bearish structure.
9. Week Ahead: What to Watch
Traders should keep a close eye on the following events for the week of February 24 – March 2:
- FOMC Minutes: Any hawkish surprises could further pressure risk assets.
- Q4 GDP Estimates: Stronger than expected growth could delay rate cuts, weighing on crypto.
- ETF Flows: Will the Feb 20 inflows sustain, or was it a one off? Continued outflows would confirm bearish momentum.
- Regulatory News: Updates on the CLARITY Act’s progress could provide a relief rally catalyst.
10. Arbitrage Opportunities (NeuralArB Perspective)
While directional traders suffer during crashes, arbitrage traders thrive on volatility. The events of February 23 created massive inefficiencies across exchanges.
The “Fear Gap”
During the sharp drop to $64,416, significant price discrepancies emerged between spot exchanges (like Coinbase/Binance) and derivatives platforms (like Bybit/Deribit). Panic selling often occurs unevenly, creating momentary gaps where an asset is cheaper on one venue than another.
DEX vs. CEX Disconnects
Decentralized Exchanges (DEXs) often lag Centralized Exchanges (CEXs) during high velocity moves due to block times and liquidity pool updates. NeuralArB’s algorithms detected spreads as wide as 1.5% on ETH/USDC pairs between Uniswap and Binance during the peak of the sell off.
How NeuralArB Captures Value
Our AI-driven system is designed to exploit these exact conditions. By utilizing millisecond latency execution, NeuralArB can lock in risk free profits by buying on the lagging exchange and selling on the leading one, regardless of overall market direction.
🚀 Join 1,000+ Traders Using NeuralArB
11. Downloadable Data & Charts
For researchers, analysts, and data driven traders, we have compiled the raw data used in this report. Access the full dataset including daily price OHLC, volume, market cap, Fear & Greed Index values, and ETF flow data.
The charts presented in this article were generated using this dataset. You are free to use this data for your own analysis with attribution to NeuralArB.
Conclusion & Trading Recommendations
The crypto market is currently navigating a storm of regulatory uncertainty, macroeconomic shifts, and extreme sentiment lows. The drop to $65,000 for Bitcoin and the historic “Extreme Fear” reading of 5/100 suggest that we are in a capitulation phase. Historically, buying when fear is this high has been a profitable long term strategy, but timing the exact bottom is perilous.
Key Takeaways for Traders:
- Preserve Capital: Avoid high leverage long positions until support at $64,000 is confirmed.
- Watch for Divergence: If price makes a lower low but RSI makes a higher low on the daily chart, a reversal may be imminent.
- Follow the Flows: Institutional ETF flows are the most accurate gauge of smart money sentiment. A streak of positive inflows is the signal to watch.
- Diversify Strategies: In a sideways or downward trending market, delta neutral strategies like arbitrage offer a way to generate yield without directional risk.
💬 Frequently Asked Questions (FAQ)
How far did Bitcoin fall during Feb 16–23, 2026?
BTC slid from ~$68,000 to a low near $64,416, then stabilized around $65,000 by Feb 23 close, marking a sharp capitulation leg after several weeks of weakness.
What triggered the sharp crypto sell off on February 23, 2026?
The report links the move to a U.S. Supreme Court 6–3 ruling striking down Trump tariffs, which injected immediate policy uncertainty and flipped markets “risk off,” amplified by heavy liquidations (incl. a $61M whale liquidation on HTX).
Why is a Crypto Fear & Greed Index reading of 5/100 important?
5/100 is “Extreme Fear” – a rare sentiment extreme the report compares to conditions not seen consistently since the 2018 bear market lows, often associated with capitulation phases (not a guaranteed bottom).
What did U.S. spot Bitcoin ETF flows show this week?
ETFs extended a 5 week outflow streak totaling $3.8B, but saw a notable + $88.1M net inflow on Feb 20, interpreted as possible dip buying by smart money.
Which altcoins outperformed while majors fell and by how much?
The piece highlights Berachain (BERA) +57.27% and Monad (MON) +34.87% as standout gainers, showing altcoin divergence even as major assets bled
What key technical levels matter most for BTC and ETH right now?
BTC: support $64,400 then $62,000, critical $60,000; resistance $68,000 then $72,000.
ETH: support $1,800; resistance $2,000 and $2,150.
Where do arbitrage opportunities show up during capitulation?
The report points to spot vs derivatives dislocations and DEX vs CEX lag during fast moves; it cites spreads up to ~1.5% on ETH/USDC between Uniswap and Binance during the peak sell off.
 Stay Connected:
 Related Analysis:
How High-Frequency Trading (HFT) (Impacts Crypto Arbitrage)
- Reinforcement Learning in Dynamic Markets (AI trading strategies)
- Crypto Arbitrage 101 (beginner’s guide to arbitrage)
Data Sources:
- CoinGecko – Real-time price data and market cap
- Yahoo Finance – Historical price data
- CoinDesk – Liquidation data
- Reuters – Market analysis
- Binance – Upcoming catalysts
Disclaimer: This analysis is for educational purposes. Arbitrage trading involves substantial risk, including custody risk, regulatory risk, and execution risk. Past performance is not indicative of future results. Never risk capital you cannot afford to lose. Consult qualified financial and legal advisors before trading.