
Crypto Market Update – January 5-11, 2026: Rally Fades on Fed Concerns; Support Holds at $90K

Crypto Market Update – January 5-11, 2026


Executive Summary: Early January Rally Exhausts; Consolidation Phase Begins


After the explosive +8.8% rally during January 1-6, Bitcoin retreated -3.3% during January 5-11, settling at $90,442. The week was characterized by early momentum fading on Fed hawkish messaging, ETF outflows resuming, and macro uncertainty around the January 10 jobs report.


Weekly Snapshot:

    • Bitcoin: $91,373 → $90,442 (-3.3%, but peaked $93,927 on Jan 6)

    • Ethereum: $3,220 → $3,120 (-3.1%, stabilizing near support)

    • Peak-to-Close Volatility: $93,927 (Jan 6 peak) to $90,442 (Jan 11 close) = $3,485 swing

    • ETF Flows: Inverted from +$200M early-week to -$260M by week-end (profit-taking)

    • Liquidations: $460M total on January 8 ($415M longs) as leverage unwind occurred

    • Sentiment: Shifted from “Fear” (35/100) back to “Extreme Fear” (28/100)

    • Bitcoin Dominance: Stabilized at 59% (capital rotating internally, not exiting)

The Critical Point: While the pullback appears negative in headline returns, it actually validates institutional support at $90K. This is healthy consolidation, not breakdown.


Part 1: Why Did Momentum Fade?


Three Catalysts Converged


1. Fed Hawkish Messaging:
FOMC meeting minutes released early in the week reinforced that the Fed is staying restrictive longer than previously hoped. While rate cuts remain possible, they’re no longer “guaranteed” by the market. This reversed the January 1-6 narrative of “abundant Fed cuts coming.”


Inflation reality: Core inflation remains sticky at 2.7%, forcing the Fed to maintain cautious stance. This messaging hit crypto particularly hard because:

    • Investors repriced 2026 Fed cut expectations (from 4-5 cuts to 2-3 cuts)

    • Capital rotated from risk assets (crypto) back to bonds and traditional safe-havens

    • Institutions took profits knowing the January rally couldn’t sustainably move to $100K+ without Fed dovish signal

2. Jobs Report Anxiety (Friday, Jan 10):
All week, traders were watching for January 10’s Non-Farm Payroll report. The expectation: deteriorating labor market would force the Fed to pivot more dovish. But markets heading into the data expected firm employment numbers, which would reinforce the Fed’s restrictive stance.

Result: Ahead of the release, institutions de-risked (selling Thursday/Friday) to avoid overnight gap risk. The jobs report came in as expected (stable labor market), removing the last dovish catalyst.


3. Rotation, Not Panic:
Critical distinction: this wasn’t capitulation selling. ETF outflows were modest (-$260M), liquidations were isolated to leveraged traders ($460M), and support at $90K held with institutional buying interest.


This is profit-taking after early-week rallies, not reversal of the bull thesis.


Part 2: The Technical Breakdown

Bitcoin & Ethereum Daily Price Action

The Jan 6 Peak and Failure to $95K


Bitcoin peaked at $93,927 on January 6, coming very close to the $95K resistance level that was identified as the next critical test. The fact that BTC couldn’t break $95K despite strong momentum was significant:

    1. Sellers were positioned at $95K – Institutions likely had stop-loss sells/profit-taking orders queued there

    2. Rally exhaustion signal – When a trending asset reaches a key resistance and reverses without breaking through, it often signals momentum exhaustion

    3. Technical failure – In bull markets, you expect resistance breaks on subsequent attempts. Failing at $95K and then declining suggested the rally needed to consolidate before the next leg

The $90K Support Test (Critical Level)


What followed was a 3.3% pullback, bottoming at $90,442. But here’s the key: $90K support held firm.


Evidence of institutional support:

    • BTC tested $90K multiple times (Jan 9-11) and bounced

    • Buying interest emerged exactly at $90K (not lower)

    • Volume declined into the lows (suggesting capitulation sellers were exhausted)

This is the textbook pattern for institutional accumulation:

    • Accept a 3-4% pullback from highs

    • Buy at round support levels

    • Prevent cascading lower

    • Set up for next leg when macro clarity emerges


Part 3: ETF Flows and the Reversal Signal
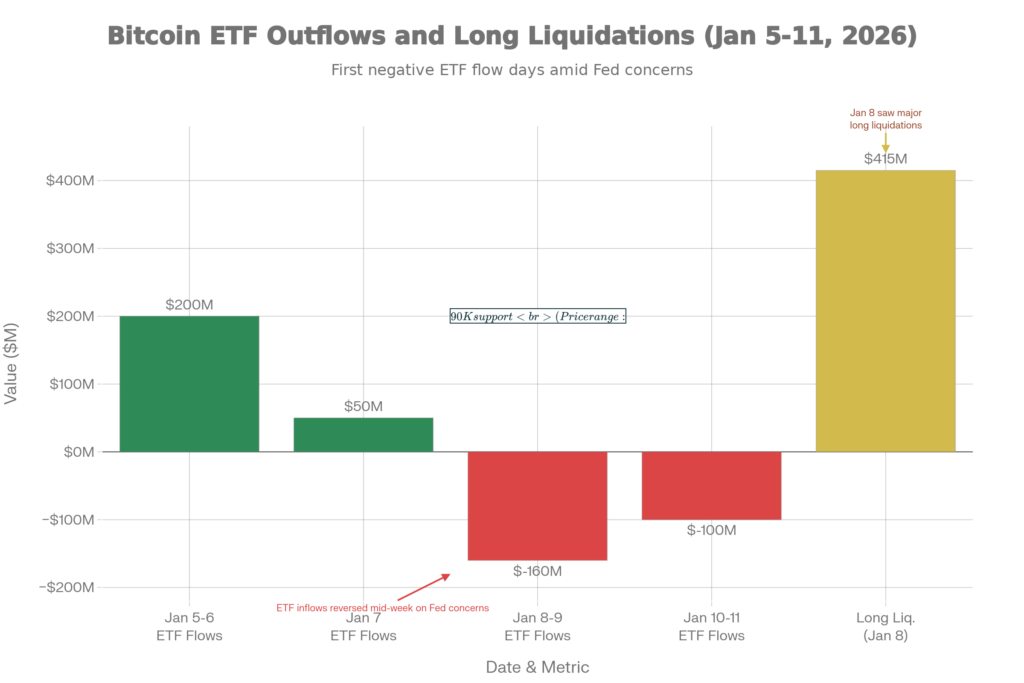
ETF Flows Reversal & Liquidations

The Specific ETF Flow Pattern


Monday-Tuesday (Jan 5-6): +$200M combined inflows (continuation of Jan 1-4 momentum)
Wednesday-Friday (Jan 7-11): -$260M combined outflows (profit-taking on Fed concerns)


This matters because:
Institutional capital is flowing out, but not in panic. The exit was orderly:

    • No single day had catastrophic outflows

    • Flows reversed gradually (not a cliff drop)

    • Capital moved from passive (spot ETFs) to active (derivatives), not away from crypto entirely

This mirrors what happened in early November: institutions took profits on strength, maintained core positions, and re-entered on dips.


What This Signals for Next Week


If $90K support holds (as it did this week), we should see flows stabilize or turn positive again next week once:

    1. Jobs report fear is digested (it came in as expected Friday)

    2. Market realizes the Fed isn’t immediately tightening (just staying patient)

    3. Risk appetite normalizes into mid-January

The pattern: Institutions don’t exit bull markets; they consolidate to de-leverage and re-accumulate.


Part 4: Ethereum Lagging But Holding


Ethereum’s -3.1% weekly decline mirrors Bitcoin’s performance, but the divergence is worth noting:


ETH story: Peaked at $3,300 on Jan 6, declined to $3,090 by Jan 9, recovered to $3,120 by Jan 11. The pattern shows ETH finding buyers at each level—very similar to BTC at $90K.


What’s concerning: Ethereum didn’t recover as strongly as Bitcoin from the lows. This suggests capital is rotating back to Bitcoin as the macro situation clarifies. Typical of institutional repositioning: “reduce alt exposure, maintain BTC core.”


Support zone: $3,090-$3,100 (holding). Break of $3,000 would signal more serious concern. Current price at $3,120 is neutral—neither bullish nor bearish.


Part 5: What Happens Next Week


Scenario 1: Macro Stabilization (60% Probability)

If:

    • Jobs report digestion shows labor market remains stable (Fed not cutting)

    • Inflation expectations don’t deteriorate further

    • Markets realize 2.7% inflation + Fed patience = buy dips, not sell rallies

Then:

    • ETF inflows resume next week

    • $95K test becomes viable late-week or early-following-week

    • $100K becomes realistic target by late January

Probability: This is the base case. Macro isn’t deteriorating; it’s just stabilizing after new-year volatility.


Scenario 2: Macro Deterioration (25% Probability)

If:

    • Economic data surprisingly weak (manufacturing, jobless claims spike)

    • Geopolitical escalation (unlikely but possible)

    • Crypto contagion (major hack, institutional failure)

Then:

    • $90K support breaks

    • Next support at $88K would be tested

    • New down-trend could form

Probability: Low. Nothing on the calendar suggests this this week.


Scenario 3: Continuation of Consolidation (15% Probability)

If:

    • Markets stay in wait-and-see mode

    • Crypto ranges $90-94K for multiple weeks

    • Institutional capital dribbles in/out

Then:

    • Boring sideways trading

    • Frustration for retail traders

    • Eventual breakout (either direction) when macro clarity emerges

Probability: Moderate. Some weeks just consolidate.


Part 6: Key Levels for the Week Ahead
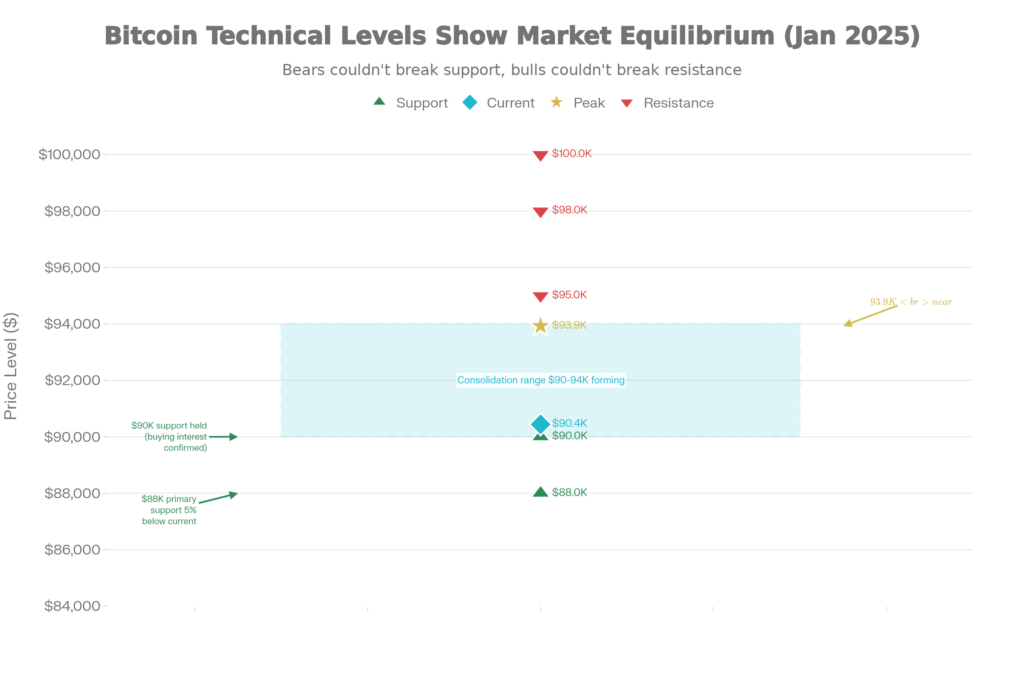
Technical Levels & Consolidation Range

Upside Targets:


$95,000 (THE KEY LEVEL)

    • If Bitcoin closes above $95K with volume, it signals breakout intent

    • Targets $98-100K on follow-through

    • Current distance: +4.4% from current levels

    • Probability this week: 35%

$98-100K (Psychological Zone)

    • Requires $95K break + positive macro commentary

    • Would mark recovery to pre-December peak zone

    • Further out, less likely this week

Downside Support:


$90,000 (Proven Support)

    • Held multiple tests this week (good sign)

    • Expect significant buying if tested again

    • Don’t expect sustained selling below this level

$88,000 (Primary Support)

    • December consolidation level

    • Would suggest correction is deepening

    • Break of $88K would be concerning for bull case

Trading the Range:


For risk managers: Current $90-95K range is legitimate buy-dip, sell-rip zone.

    • Buy support at $90K, sell resistance at $94-95K

    • Tight stops if $89K breaks

    • Allocation management critical (don’t hold through weekend on leverage)


Part 7: The Institutional Story Remains Intact


Despite this week’s pullback, the institutional adoption narrative is unshaken:

    1. Spot ETF flows remain positive YTD (despite this week’s outflows)

    2. $90K support held without cascading (institutions defending)

    3. Bitcoin dominance stabilized at 59% (no panic rotation out of crypto)

    4. Liquidations were manageable ($460M on leverage traders, not institutions)

This is the pattern of a healthy bull market: pullbacks on profit-taking and macro concern, not panic capitulation.


Conclusion: Consolidation Validates the Bull Structure


The week of January 5-11 was healthy consolidation, not breakdown. Key observations:

✅ Support at $90K proved real (institutional buyers stepped in)
✅ ETF flows reversed (profit-taking, not panic exit)
✅ Leverage was flushed (Jan 8 liquidations cleaned system)
✅ Bitcoin dominance held (capital staying in crypto, rotating within)
✅ Fed messaging clarified (less dovish, but not aggressive tightening)


For the week ahead:

    • Upside: $95K is the realistic target if macro stabilizes (60% probability)

    • Support: $90K is proven; $88K is line-in-the-sand

    • Range: $90-94K is current consolidation zone

Bottom line: Nothing this week changed the longer-term bull thesis. This is normal consolidation before the next leg. Institutions are buying dips at $90K, not capitulating. The structure remains constructive.

💬 Frequently Asked Questions (FAQ)

Is this the start of a reversal?

No. Pullbacks within bull trends are normal. Support at $90K held; institutional buying was evident. This is consolidation.

No. If anything, support levels established this week create buying opportunities. Be cautious on leverage; use tight stops if buying.

Realistic target is late January or early February IF macro stabilizes (Fed clarifies patience, inflation doesn’t spike).

Unexpected macro deterioration (recession signals, geopolitical escalation). Currently low probability, but monitor economic data this week. DYOR


📱 Stay Connected:

  • Twitter/X for real-time market alerts
  • Telegram community for live trading discussions

🔗 Related Analysis:


Data Sources:

Disclaimer: This analysis is for educational purposes. Arbitrage trading involves substantial risk, including custody risk, regulatory risk, and execution risk. Past performance is not indicative of future results. Never risk capital you cannot afford to lose. Consult qualified financial and legal advisors before trading.

Max Takeda

Max Takeda is the Chief Technology Officer at NeuralArB, where he leads the company’s technology vision, overseeing the development and implementation of cutting-edge AI algorithms and blockchain solutions that power crypto arbitrage trading efficiency. With a strong background in software engineering, artificial intelligence, and distributed ledger technology, Max combines technical expertise with strategic thinking to drive NeuralArB's mission to revolutionize the cryptocurrency trading space. Connect with Max on Twitter: @MaxTakeda91

Crypto Market Update – January 5-11, 2026: Rally Fades on Fed Concerns; Support Holds at $90K

Crypto Market Update – January 5-11, 2026


Executive Summary: Early January Rally Exhausts; Consolidation Phase Begins


After the explosive +8.8% rally during January 1-6, Bitcoin retreated -3.3% during January 5-11, settling at $90,442. The week was characterized by early momentum fading on Fed hawkish messaging, ETF outflows resuming, and macro uncertainty around the January 10 jobs report.


Weekly Snapshot:

    • Bitcoin: $91,373 → $90,442 (-3.3%, but peaked $93,927 on Jan 6)

    • Ethereum: $3,220 → $3,120 (-3.1%, stabilizing near support)

    • Peak-to-Close Volatility: $93,927 (Jan 6 peak) to $90,442 (Jan 11 close) = $3,485 swing

    • ETF Flows: Inverted from +$200M early-week to -$260M by week-end (profit-taking)

    • Liquidations: $460M total on January 8 ($415M longs) as leverage unwind occurred

    • Sentiment: Shifted from “Fear” (35/100) back to “Extreme Fear” (28/100)

    • Bitcoin Dominance: Stabilized at 59% (capital rotating internally, not exiting)

The Critical Point: While the pullback appears negative in headline returns, it actually validates institutional support at $90K. This is healthy consolidation, not breakdown.


Part 1: Why Did Momentum Fade?


Three Catalysts Converged


1. Fed Hawkish Messaging:
FOMC meeting minutes released early in the week reinforced that the Fed is staying restrictive longer than previously hoped. While rate cuts remain possible, they’re no longer “guaranteed” by the market. This reversed the January 1-6 narrative of “abundant Fed cuts coming.”


Inflation reality: Core inflation remains sticky at 2.7%, forcing the Fed to maintain cautious stance. This messaging hit crypto particularly hard because:

    • Investors repriced 2026 Fed cut expectations (from 4-5 cuts to 2-3 cuts)

    • Capital rotated from risk assets (crypto) back to bonds and traditional safe-havens

    • Institutions took profits knowing the January rally couldn’t sustainably move to $100K+ without Fed dovish signal

2. Jobs Report Anxiety (Friday, Jan 10):
All week, traders were watching for January 10’s Non-Farm Payroll report. The expectation: deteriorating labor market would force the Fed to pivot more dovish. But markets heading into the data expected firm employment numbers, which would reinforce the Fed’s restrictive stance.

Result: Ahead of the release, institutions de-risked (selling Thursday/Friday) to avoid overnight gap risk. The jobs report came in as expected (stable labor market), removing the last dovish catalyst.


3. Rotation, Not Panic:
Critical distinction: this wasn’t capitulation selling. ETF outflows were modest (-$260M), liquidations were isolated to leveraged traders ($460M), and support at $90K held with institutional buying interest.


This is profit-taking after early-week rallies, not reversal of the bull thesis.


Part 2: The Technical Breakdown

Bitcoin & Ethereum Daily Price Action

The Jan 6 Peak and Failure to $95K


Bitcoin peaked at $93,927 on January 6, coming very close to the $95K resistance level that was identified as the next critical test. The fact that BTC couldn’t break $95K despite strong momentum was significant:

    1. Sellers were positioned at $95K – Institutions likely had stop-loss sells/profit-taking orders queued there

    2. Rally exhaustion signal – When a trending asset reaches a key resistance and reverses without breaking through, it often signals momentum exhaustion

    3. Technical failure – In bull markets, you expect resistance breaks on subsequent attempts. Failing at $95K and then declining suggested the rally needed to consolidate before the next leg

The $90K Support Test (Critical Level)


What followed was a 3.3% pullback, bottoming at $90,442. But here’s the key: $90K support held firm.


Evidence of institutional support:

    • BTC tested $90K multiple times (Jan 9-11) and bounced

    • Buying interest emerged exactly at $90K (not lower)

    • Volume declined into the lows (suggesting capitulation sellers were exhausted)

This is the textbook pattern for institutional accumulation:

    • Accept a 3-4% pullback from highs

    • Buy at round support levels

    • Prevent cascading lower

    • Set up for next leg when macro clarity emerges


Part 3: ETF Flows and the Reversal Signal

ETF Flows Reversal & Liquidations

The Specific ETF Flow Pattern


Monday-Tuesday (Jan 5-6): +$200M combined inflows (continuation of Jan 1-4 momentum)
Wednesday-Friday (Jan 7-11): -$260M combined outflows (profit-taking on Fed concerns)


This matters because:
Institutional capital is flowing out, but not in panic. The exit was orderly:

    • No single day had catastrophic outflows

    • Flows reversed gradually (not a cliff drop)

    • Capital moved from passive (spot ETFs) to active (derivatives), not away from crypto entirely

This mirrors what happened in early November: institutions took profits on strength, maintained core positions, and re-entered on dips.


What This Signals for Next Week


If $90K support holds (as it did this week), we should see flows stabilize or turn positive again next week once:

    1. Jobs report fear is digested (it came in as expected Friday)

    2. Market realizes the Fed isn’t immediately tightening (just staying patient)

    3. Risk appetite normalizes into mid-January

The pattern: Institutions don’t exit bull markets; they consolidate to de-leverage and re-accumulate.


Part 4: Ethereum Lagging But Holding


Ethereum’s -3.1% weekly decline mirrors Bitcoin’s performance, but the divergence is worth noting:


ETH story: Peaked at $3,300 on Jan 6, declined to $3,090 by Jan 9, recovered to $3,120 by Jan 11. The pattern shows ETH finding buyers at each level—very similar to BTC at $90K.


What’s concerning: Ethereum didn’t recover as strongly as Bitcoin from the lows. This suggests capital is rotating back to Bitcoin as the macro situation clarifies. Typical of institutional repositioning: “reduce alt exposure, maintain BTC core.”


Support zone: $3,090-$3,100 (holding). Break of $3,000 would signal more serious concern. Current price at $3,120 is neutral—neither bullish nor bearish.


Part 5: What Happens Next Week


Scenario 1: Macro Stabilization (60% Probability)

If:

    • Jobs report digestion shows labor market remains stable (Fed not cutting)

    • Inflation expectations don’t deteriorate further

    • Markets realize 2.7% inflation + Fed patience = buy dips, not sell rallies

Then:

    • ETF inflows resume next week

    • $95K test becomes viable late-week or early-following-week

    • $100K becomes realistic target by late January

Probability: This is the base case. Macro isn’t deteriorating; it’s just stabilizing after new-year volatility.


Scenario 2: Macro Deterioration (25% Probability)

If:

    • Economic data surprisingly weak (manufacturing, jobless claims spike)

    • Geopolitical escalation (unlikely but possible)

    • Crypto contagion (major hack, institutional failure)

Then:

    • $90K support breaks

    • Next support at $88K would be tested

    • New down-trend could form

Probability: Low. Nothing on the calendar suggests this this week.


Scenario 3: Continuation of Consolidation (15% Probability)

If:

    • Markets stay in wait-and-see mode

    • Crypto ranges $90-94K for multiple weeks

    • Institutional capital dribbles in/out

Then:

    • Boring sideways trading

    • Frustration for retail traders

    • Eventual breakout (either direction) when macro clarity emerges

Probability: Moderate. Some weeks just consolidate.


Part 6: Key Levels for the Week Ahead

Technical Levels & Consolidation Range

Upside Targets:


$95,000 (THE KEY LEVEL)

    • If Bitcoin closes above $95K with volume, it signals breakout intent

    • Targets $98-100K on follow-through

    • Current distance: +4.4% from current levels

    • Probability this week: 35%

$98-100K (Psychological Zone)

    • Requires $95K break + positive macro commentary

    • Would mark recovery to pre-December peak zone

    • Further out, less likely this week

Downside Support:


$90,000 (Proven Support)

    • Held multiple tests this week (good sign)

    • Expect significant buying if tested again

    • Don’t expect sustained selling below this level

$88,000 (Primary Support)

    • December consolidation level

    • Would suggest correction is deepening

    • Break of $88K would be concerning for bull case

Trading the Range:


For risk managers: Current $90-95K range is legitimate buy-dip, sell-rip zone.

    • Buy support at $90K, sell resistance at $94-95K

    • Tight stops if $89K breaks

    • Allocation management critical (don’t hold through weekend on leverage)


Part 7: The Institutional Story Remains Intact


Despite this week’s pullback, the institutional adoption narrative is unshaken:

    1. Spot ETF flows remain positive YTD (despite this week’s outflows)

    2. $90K support held without cascading (institutions defending)

    3. Bitcoin dominance stabilized at 59% (no panic rotation out of crypto)

    4. Liquidations were manageable ($460M on leverage traders, not institutions)

This is the pattern of a healthy bull market: pullbacks on profit-taking and macro concern, not panic capitulation.


Conclusion: Consolidation Validates the Bull Structure


The week of January 5-11 was healthy consolidation, not breakdown. Key observations:

✅ Support at $90K proved real (institutional buyers stepped in)
✅ ETF flows reversed (profit-taking, not panic exit)
✅ Leverage was flushed (Jan 8 liquidations cleaned system)
✅ Bitcoin dominance held (capital staying in crypto, rotating within)
✅ Fed messaging clarified (less dovish, but not aggressive tightening)


For the week ahead:

    • Upside: $95K is the realistic target if macro stabilizes (60% probability)

    • Support: $90K is proven; $88K is line-in-the-sand

    • Range: $90-94K is current consolidation zone

Bottom line: Nothing this week changed the longer-term bull thesis. This is normal consolidation before the next leg. Institutions are buying dips at $90K, not capitulating. The structure remains constructive.

💬 Frequently Asked Questions (FAQ)

Is this the start of a reversal?

No. Pullbacks within bull trends are normal. Support at $90K held; institutional buying was evident. This is consolidation.

No. If anything, support levels established this week create buying opportunities. Be cautious on leverage; use tight stops if buying.

Realistic target is late January or early February IF macro stabilizes (Fed clarifies patience, inflation doesn’t spike).

Unexpected macro deterioration (recession signals, geopolitical escalation). Currently low probability, but monitor economic data this week. DYOR


📱 Stay Connected:

  • Twitter/X for real-time market alerts
  • Telegram community for live trading discussions

🔗 Related Analysis:


Data Sources:

Disclaimer: This analysis is for educational purposes. Arbitrage trading involves substantial risk, including custody risk, regulatory risk, and execution risk. Past performance is not indicative of future results. Never risk capital you cannot afford to lose. Consult qualified financial and legal advisors before trading.

Max Takeda

Max Takeda is the Chief Technology Officer at NeuralArB, where he leads the company’s technology vision, overseeing the development and implementation of cutting-edge AI algorithms and blockchain solutions that power crypto arbitrage trading efficiency. With a strong background in software engineering, artificial intelligence, and distributed ledger technology, Max combines technical expertise with strategic thinking to drive NeuralArB's mission to revolutionize the cryptocurrency trading space. Connect with Max on Twitter: @MaxTakeda91

Crypto Market Update – January 5-11, 2026: Rally Fades on Fed Concerns; Support Holds at $90K

Crypto Market Update – January 5-11, 2026


Executive Summary: Early January Rally Exhausts; Consolidation Phase Begins


After the explosive +8.8% rally during January 1-6, Bitcoin retreated -3.3% during January 5-11, settling at $90,442. The week was characterized by early momentum fading on Fed hawkish messaging, ETF outflows resuming, and macro uncertainty around the January 10 jobs report.


Weekly Snapshot:

    • Bitcoin: $91,373 → $90,442 (-3.3%, but peaked $93,927 on Jan 6)

    • Ethereum: $3,220 → $3,120 (-3.1%, stabilizing near support)

    • Peak-to-Close Volatility: $93,927 (Jan 6 peak) to $90,442 (Jan 11 close) = $3,485 swing

    • ETF Flows: Inverted from +$200M early-week to -$260M by week-end (profit-taking)

    • Liquidations: $460M total on January 8 ($415M longs) as leverage unwind occurred

    • Sentiment: Shifted from “Fear” (35/100) back to “Extreme Fear” (28/100)

    • Bitcoin Dominance: Stabilized at 59% (capital rotating internally, not exiting)

The Critical Point: While the pullback appears negative in headline returns, it actually validates institutional support at $90K. This is healthy consolidation, not breakdown.


Part 1: Why Did Momentum Fade?


Three Catalysts Converged


1. Fed Hawkish Messaging:
FOMC meeting minutes released early in the week reinforced that the Fed is staying restrictive longer than previously hoped. While rate cuts remain possible, they’re no longer “guaranteed” by the market. This reversed the January 1-6 narrative of “abundant Fed cuts coming.”


Inflation reality: Core inflation remains sticky at 2.7%, forcing the Fed to maintain cautious stance. This messaging hit crypto particularly hard because:

    • Investors repriced 2026 Fed cut expectations (from 4-5 cuts to 2-3 cuts)

    • Capital rotated from risk assets (crypto) back to bonds and traditional safe-havens

    • Institutions took profits knowing the January rally couldn’t sustainably move to $100K+ without Fed dovish signal

2. Jobs Report Anxiety (Friday, Jan 10):
All week, traders were watching for January 10’s Non-Farm Payroll report. The expectation: deteriorating labor market would force the Fed to pivot more dovish. But markets heading into the data expected firm employment numbers, which would reinforce the Fed’s restrictive stance.

Result: Ahead of the release, institutions de-risked (selling Thursday/Friday) to avoid overnight gap risk. The jobs report came in as expected (stable labor market), removing the last dovish catalyst.


3. Rotation, Not Panic:
Critical distinction: this wasn’t capitulation selling. ETF outflows were modest (-$260M), liquidations were isolated to leveraged traders ($460M), and support at $90K held with institutional buying interest.


This is profit-taking after early-week rallies, not reversal of the bull thesis.


Part 2: The Technical Breakdown

Bitcoin & Ethereum Daily Price Action

The Jan 6 Peak and Failure to $95K


Bitcoin peaked at $93,927 on January 6, coming very close to the $95K resistance level that was identified as the next critical test. The fact that BTC couldn’t break $95K despite strong momentum was significant:

    1. Sellers were positioned at $95K – Institutions likely had stop-loss sells/profit-taking orders queued there

    2. Rally exhaustion signal – When a trending asset reaches a key resistance and reverses without breaking through, it often signals momentum exhaustion

    3. Technical failure – In bull markets, you expect resistance breaks on subsequent attempts. Failing at $95K and then declining suggested the rally needed to consolidate before the next leg

The $90K Support Test (Critical Level)


What followed was a 3.3% pullback, bottoming at $90,442. But here’s the key: $90K support held firm.


Evidence of institutional support:

    • BTC tested $90K multiple times (Jan 9-11) and bounced

    • Buying interest emerged exactly at $90K (not lower)

    • Volume declined into the lows (suggesting capitulation sellers were exhausted)

This is the textbook pattern for institutional accumulation:

    • Accept a 3-4% pullback from highs

    • Buy at round support levels

    • Prevent cascading lower

    • Set up for next leg when macro clarity emerges


Part 3: ETF Flows and the Reversal Signal

ETF Flows Reversal & Liquidations

The Specific ETF Flow Pattern


Monday-Tuesday (Jan 5-6): +$200M combined inflows (continuation of Jan 1-4 momentum)
Wednesday-Friday (Jan 7-11): -$260M combined outflows (profit-taking on Fed concerns)


This matters because:
Institutional capital is flowing out, but not in panic. The exit was orderly:

    • No single day had catastrophic outflows

    • Flows reversed gradually (not a cliff drop)

    • Capital moved from passive (spot ETFs) to active (derivatives), not away from crypto entirely

This mirrors what happened in early November: institutions took profits on strength, maintained core positions, and re-entered on dips.


What This Signals for Next Week


If $90K support holds (as it did this week), we should see flows stabilize or turn positive again next week once:

    1. Jobs report fear is digested (it came in as expected Friday)

    2. Market realizes the Fed isn’t immediately tightening (just staying patient)

    3. Risk appetite normalizes into mid-January

The pattern: Institutions don’t exit bull markets; they consolidate to de-leverage and re-accumulate.


Part 4: Ethereum Lagging But Holding


Ethereum’s -3.1% weekly decline mirrors Bitcoin’s performance, but the divergence is worth noting:


ETH story: Peaked at $3,300 on Jan 6, declined to $3,090 by Jan 9, recovered to $3,120 by Jan 11. The pattern shows ETH finding buyers at each level—very similar to BTC at $90K.


What’s concerning: Ethereum didn’t recover as strongly as Bitcoin from the lows. This suggests capital is rotating back to Bitcoin as the macro situation clarifies. Typical of institutional repositioning: “reduce alt exposure, maintain BTC core.”


Support zone: $3,090-$3,100 (holding). Break of $3,000 would signal more serious concern. Current price at $3,120 is neutral—neither bullish nor bearish.


Part 5: What Happens Next Week


Scenario 1: Macro Stabilization (60% Probability)

If:

    • Jobs report digestion shows labor market remains stable (Fed not cutting)

    • Inflation expectations don’t deteriorate further

    • Markets realize 2.7% inflation + Fed patience = buy dips, not sell rallies

Then:

    • ETF inflows resume next week

    • $95K test becomes viable late-week or early-following-week

    • $100K becomes realistic target by late January

Probability: This is the base case. Macro isn’t deteriorating; it’s just stabilizing after new-year volatility.


Scenario 2: Macro Deterioration (25% Probability)

If:

    • Economic data surprisingly weak (manufacturing, jobless claims spike)

    • Geopolitical escalation (unlikely but possible)

    • Crypto contagion (major hack, institutional failure)

Then:

    • $90K support breaks

    • Next support at $88K would be tested

    • New down-trend could form

Probability: Low. Nothing on the calendar suggests this this week.


Scenario 3: Continuation of Consolidation (15% Probability)

If:

    • Markets stay in wait-and-see mode

    • Crypto ranges $90-94K for multiple weeks

    • Institutional capital dribbles in/out

Then:

    • Boring sideways trading

    • Frustration for retail traders

    • Eventual breakout (either direction) when macro clarity emerges

Probability: Moderate. Some weeks just consolidate.


Part 6: Key Levels for the Week Ahead

Technical Levels & Consolidation Range

Upside Targets:


$95,000 (THE KEY LEVEL)

    • If Bitcoin closes above $95K with volume, it signals breakout intent

    • Targets $98-100K on follow-through

    • Current distance: +4.4% from current levels

    • Probability this week: 35%

$98-100K (Psychological Zone)

    • Requires $95K break + positive macro commentary

    • Would mark recovery to pre-December peak zone

    • Further out, less likely this week

Downside Support:


$90,000 (Proven Support)

    • Held multiple tests this week (good sign)

    • Expect significant buying if tested again

    • Don’t expect sustained selling below this level

$88,000 (Primary Support)

    • December consolidation level

    • Would suggest correction is deepening

    • Break of $88K would be concerning for bull case

Trading the Range:


For risk managers: Current $90-95K range is legitimate buy-dip, sell-rip zone.

    • Buy support at $90K, sell resistance at $94-95K

    • Tight stops if $89K breaks

    • Allocation management critical (don’t hold through weekend on leverage)


Part 7: The Institutional Story Remains Intact


Despite this week’s pullback, the institutional adoption narrative is unshaken:

    1. Spot ETF flows remain positive YTD (despite this week’s outflows)

    2. $90K support held without cascading (institutions defending)

    3. Bitcoin dominance stabilized at 59% (no panic rotation out of crypto)

    4. Liquidations were manageable ($460M on leverage traders, not institutions)

This is the pattern of a healthy bull market: pullbacks on profit-taking and macro concern, not panic capitulation.


Conclusion: Consolidation Validates the Bull Structure


The week of January 5-11 was healthy consolidation, not breakdown. Key observations:

✅ Support at $90K proved real (institutional buyers stepped in)
✅ ETF flows reversed (profit-taking, not panic exit)
✅ Leverage was flushed (Jan 8 liquidations cleaned system)
✅ Bitcoin dominance held (capital staying in crypto, rotating within)
✅ Fed messaging clarified (less dovish, but not aggressive tightening)


For the week ahead:

    • Upside: $95K is the realistic target if macro stabilizes (60% probability)

    • Support: $90K is proven; $88K is line-in-the-sand

    • Range: $90-94K is current consolidation zone

Bottom line: Nothing this week changed the longer-term bull thesis. This is normal consolidation before the next leg. Institutions are buying dips at $90K, not capitulating. The structure remains constructive.

💬 Frequently Asked Questions (FAQ)

Is this the start of a reversal?

No. Pullbacks within bull trends are normal. Support at $90K held; institutional buying was evident. This is consolidation.

No. If anything, support levels established this week create buying opportunities. Be cautious on leverage; use tight stops if buying.

Realistic target is late January or early February IF macro stabilizes (Fed clarifies patience, inflation doesn’t spike).

Unexpected macro deterioration (recession signals, geopolitical escalation). Currently low probability, but monitor economic data this week. DYOR


📱 Stay Connected:

  • Twitter/X for real-time market alerts
  • Telegram community for live trading discussions

🔗 Related Analysis:


Data Sources:

Disclaimer: This analysis is for educational purposes. Arbitrage trading involves substantial risk, including custody risk, regulatory risk, and execution risk. Past performance is not indicative of future results. Never risk capital you cannot afford to lose. Consult qualified financial and legal advisors before trading.

Max Takeda

Max Takeda is the Chief Technology Officer at NeuralArB, where he leads the company’s technology vision, overseeing the development and implementation of cutting-edge AI algorithms and blockchain solutions that power crypto arbitrage trading efficiency. With a strong background in software engineering, artificial intelligence, and distributed ledger technology, Max combines technical expertise with strategic thinking to drive NeuralArB's mission to revolutionize the cryptocurrency trading space. Connect with Max on Twitter: @MaxTakeda91

Still have questions, contact us:

© 2026 NAB CONSULTANCY LTD. All right reserved.

These materials are for general information purposes only and are not investment advice or a recommendation or solicitation to buy, sell or hold any cryptoasset or to engage in any specific trading strategy. Some crypto products and markets are unregulated, and you may not be protected by government compensation and/or regulatory protection schemes. The unpredictable nature of the cryptoasset markets can lead to loss of funds. Tax may be payable on any return and/or on any increase in the value of your cryptoassets and you should seek independent advice on your taxation position.

All trademarks, logos, and brand names are the property of their respective owners. All company, product, and service names used in this website are for identification purposes only. Use of these names, trademarks, and brands does not imply endorsement.

NAB does not provide investment or brokerage services. All cryptocurrency spot, margin, and futures products are offered by third-party platforms. Products and services availability varies by country.

Past performance, whether actual or indicated by historical or simulated tests of strategies, is no guarantee of future performance or success. There is a possibility that you may sustain a loss equal to or greater than your entire investment regardless of which asset class you trade (i.e. cryptocurrency); therefore, you should not invest or risk money that you cannot afford to lose. Online trading is not suitable for all investors. Before trading any asset class, customers should review NFA and CFTC advisories, and other relevant disclosures. System access, trade placement, and execution may be delayed or fail due to market volatility and volume, quote delays, system and software errors, Internet traffic, outages and other unforeseen factors.

Still have questions, contact us:

© 2026 NAB CONSULTANCY LTD. All right reserved.

These materials are for general information purposes only and are not investment advice or a recommendation or solicitation to buy, sell or hold any cryptoasset or to engage in any specific trading strategy. Some crypto products and markets are unregulated, and you may not be protected by government compensation and/or regulatory protection schemes. The unpredictable nature of the cryptoasset markets can lead to loss of funds. Tax may be payable on any return and/or on any increase in the value of your cryptoassets and you should seek independent advice on your taxation position.

All trademarks, logos, and brand names are the property of their respective owners. All company, product, and service names used in this website are for identification purposes only. Use of these names, trademarks, and brands does not imply endorsement.

NAB does not provide investment or brokerage services. All cryptocurrency spot, margin, and futures products are offered by third-party platforms. Products and services availability varies by country.

Past performance, whether actual or indicated by historical or simulated tests of strategies, is no guarantee of future performance or success. There is a possibility that you may sustain a loss equal to or greater than your entire investment regardless of which asset class you trade (i.e. cryptocurrency); therefore, you should not invest or risk money that you cannot afford to lose. Online trading is not suitable for all investors. Before trading any asset class, customers should review NFA and CFTC advisories, and other relevant disclosures. System access, trade placement, and execution may be delayed or fail due to market volatility and volume, quote delays, system and software errors, Internet traffic, outages and other unforeseen factors.

Still have questions, contact us:

© 2026 NAB CONSULTANCY LTD. All right reserved.

These materials are for general information purposes only and are not investment advice or a recommendation or solicitation to buy, sell or hold any cryptoasset or to engage in any specific trading strategy. Some crypto products and markets are unregulated, and you may not be protected by government compensation and/or regulatory protection schemes. The unpredictable nature of the cryptoasset markets can lead to loss of funds. Tax may be payable on any return and/or on any increase in the value of your cryptoassets and you should seek independent advice on your taxation position.

All trademarks, logos, and brand names are the property of their respective owners. All company, product, and service names used in this website are for identification purposes only. Use of these names, trademarks, and brands does not imply endorsement.

NAB does not provide investment or brokerage services. All cryptocurrency spot, margin, and futures products are offered by third-party platforms. Products and services availability varies by country.

Past performance, whether actual or indicated by historical or simulated tests of strategies, is no guarantee of future performance or success. There is a possibility that you may sustain a loss equal to or greater than your entire investment regardless of which asset class you trade (i.e. cryptocurrency); therefore, you should not invest or risk money that you cannot afford to lose. Online trading is not suitable for all investors. Before trading any asset class, customers should review NFA and CFTC advisories, and other relevant disclosures. System access, trade placement, and execution may be delayed or fail due to market volatility and volume, quote delays, system and software errors, Internet traffic, outages and other unforeseen factors.

btc address
bc1ql27m5pygdxpmnvjzkamaj88mwphwl8q6n9n06l

Only use this insured address for BTC on the Bitcoin network. Do not send Ordinals. Lost funds cannot be recovered.