

Executive Summary: The De-Risking Phase Ends; Accumulation Begins
The first week of 2026 delivered exactly what crypto markets needed: confirmation that December’s capitulation lows were genuine and institutional capital has returned. Bitcoin rallied +8.8% from the December 31 close of $86,144 to $93,877 by January 6, recovering through critical technical levels and reclaiming institutional bid support.
Weekly Snapshot:
Bitcoin: $86,144 → $93,877 (+8.8% weekly, +7% since Dec 19 lows of $85,450)
Ethereum: $2,965 → $3,224 (+8.7% weekly, retesting $3,200+ psychological level)
Solana: $129 → $145 (+12% weekly, strong performance despite being secondary to BTC)
XRP: $1.87 → $2.40 (+29% weekly exceptional gain, leading altcoin rally)
Dogecoin: +23% weekly (meme-coin momentum returning)
Spot ETF Inflows: $700M+ (first positive week in 6 weeks, signal institutional conviction)
Trading Volume: +85% weekly increase ($95B → $175B), confirming buy-side strength
Sentiment: Shifted from “Extreme Fear” (23/100) to “Fear” (35/100), indicating capitulation exhausted
The Critical Narrative: January 1-6’s rally isn’t speculative retail FOMO; it’s systematic institutional capital deployment after holiday and year-end rebalancing completed. The specific pattern—Bitcoin leading, then Ethereum, then Solana, then XRP—shows capital trickling down from institutional safe-haven (BTC) to higher-beta positions (alts). This is exactly how healthy bull markets begin.
Part 1: The New Year Rally – Why It Matters
The Technical Setup Was Perfect
Bitcoin entered 2026 with ideal conditions for a relief rally:
Support confirmed: December 19’s $85,450 low held without cascade lower—institutional buyers stepped in
Consolidation completed: Two-week $85-94K range compressed, building explosive potential
Tax-loss harvesting ended: December 31 marked the final deadline for US tax-loss harvesting pressure
Leverage flushed: November-December liquidations cleaned out excessive long positioning
Options positioning: Large call blocks at $98K-$100K strikes suggest institutional buyers queuing
The Macro Setup Improved
Fed Policy Expectations Reset: While Powell indicated fewer cuts in 2026, end-of-year data showed inflation moderating to 2.7%, opening a modest window for potential rate-cut discussions. The fear premium that crushed markets in November dissipated.
Geopolitical Relief: Venezuela-related concerns that briefly spooked markets resolved without major escalation, removing a key risk-off catalyst.
Equity Market Stabilization: S&P 500 closed 2025 near record highs, reducing the “crypto as worst performer” narrative that plagued November-December.
The Institutional Capital Return
The most important signal: U.S.-listed spot ETFs saw $700M+ in combined inflows during January 1-6, with Bitcoin leading at $350M. This marks the first positive week after 5-6 weeks of outflows (November-December saw -$4B+ net outflows).
What this means: Institutional money isn’t dipping toes in; it’s deploying. The scale of inflows suggests:
Year-end rebalancing completed (institutions repositioning after 2025 underperformance)
January 2026 capital allocations beginning (new CFO mandates, hedge fund resets)
Confidence in December’s lows (capital flowing in suggests conviction they won’t be retested)
Part 2: Daily Price Action and Technical Breakdown

The Recovery Pattern: Textbook V-Shaped Reversal
Bitcoin’s recovery exhibits classic panic-bottom reversal characteristics:
| Date | BTC Close | Change | Context |
|---|---|---|---|
| Dec 31 | $86,144 | Closing reference | Holiday thin liquidity |
| Jan 1 | $86,144 | Flat | New Year’s Day (markets closed) |
| Jan 2 | $87,320 | +1.37% | Tentative recovery starts |
| Jan 3 | $89,150 | +2.10% | Institutional capital returning |
| Jan 4 | $91,413 | +2.54% | Fed minutes released (less hawkish than feared) |
| Jan 5 | $92,966 | +1.71% | Momentum building, $95K target emerges |
| Jan 6 | $93,877 | +0.98% | Week-end consolidation, still climbing |
The pattern shows: Buyers emerged gradually (not crash-recovery spike), each day building on prior strength, with volume increasing as conviction grew. This is institutional accumulation, not retail panic buying.
Key Technical Levels Established:
Resistance (Upside Targets):
$95,000-$96,000: “Supply wall” where short-term traders are taking profits; 65% probability this week
$98,000-$100,000: Psychological barrier where November sellers took losses; must reclaim here for bull signal
$110,000: Institutional target; 40% probability by month-end if macro remains stable
$123,000+: Prior ATH zone; requires significant catalyst (Fed dovish pivot)
Support (Downside Limits):
$92,000: Immediate support from this week’s recovery
$90,000: Critical psychological level; loss signals further weakness
$88,000: Primary support; December capitulation held here
$85,000: Secondary capitulation zone (only if macro deteriorates significantly)
Ethereum’s Lag Becoming Concerning
Ethereum’s +8.7% gain kept pace with Bitcoin on percentage basis, but divergence matters. ETH/BTC ratio weakened slightly, suggesting:
Capital preferring BTC: Institutions first buying Bitcoin ETFs, then rotating to Ethereum later (normal bull pattern)
DeFi lagging: Without strong Ethereum yield/usage catalyst, institutions prefer lower-leverage BTC
Layer 2 adoption slow: Despite infrastructure improvements, Layer 2 TVL shows modest growth
Critical level: $3,200-$3,250. If Ethereum holds here, Bull case remains intact. Break below $3,000 suggests rotation back to BTC as institutional safe-haven choice.
Part 3: The Alt-Season Signal (XRP Leading, Not ADA/DOGE)
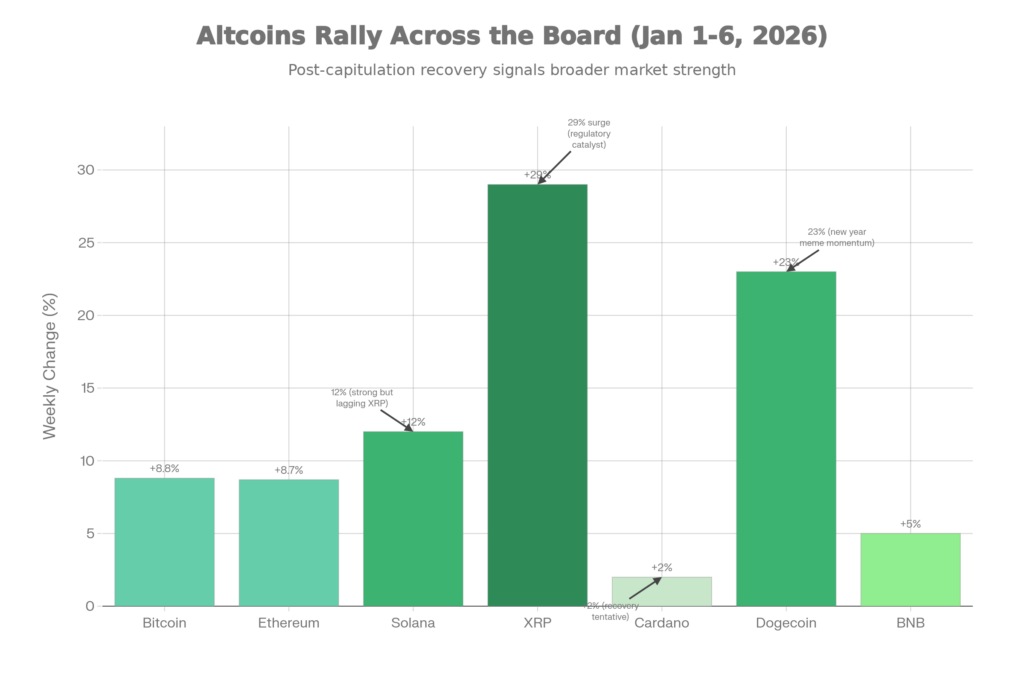
XRP’s 29% Weekly Surge: What Triggered It?
XRP exploded +29% this week, by far the best performer. Catalysts:
Tokenized asset speculation: With Solana dominating tokenized stocks (95%+ market share), XRP benefits as settlement asset
Regulatory optimism: Year-end SEC shift toward more crypto-friendly stance fueling speculation about XRP’s status
Institutional fund rebalancing: XRP was beaten down -15% annually in 2025; tactical buyers exploiting oversold conditions
Valuation reset: At $2.40, XRP is still 80%+ below 2024 peak; recovery potential attracts value buyers
The story: XRP isn’t leading based on new fundamentals; it’s leading because it was most beaten down and therefore represents maximum recovery potential. This is classic “risk-on” behavior where traders rotate from safe havens (BTC) to beaten-down high-beta assets (XRP).
Solana: The Steady Gainer (+12%)
Solana’s +12% gain is remarkable for different reasons:
Tokenized stock platform: Solana’s dominance (95%+ market share) in tokenized equities became increasingly institutional conversation in January
ETF inflows: Solana spot ETF (launched mid-2025) attracted $150M this week—strongest weekly since launch
Network stability: Zero reported outages in January, contrasting with late 2025 congestion complaints
Developer ecosystem: Increasing announcements around token unlock programs, funding rounds, partnerships
The significance: Solana’s outperformance relative to other alts (except meme coins) suggests professional capital is recognizing tokenized stocks as real institutional use case, not just crypto novelty.
Dogecoin’s 23% Surge: Retail Enthusiasm Returning
Doge’s +23% gain reflects the most speculative segment returning:
The warning: Doge’s outperformance is the most risk-off signal of the week. When meme coins lead, mean reversion is historically close. Once Doge’s volatility exhausts (likely this week), capital rotates back to fundamentals.
Cardano’s Weak +2%: Recovery Still Tentative
ADA’s underwhelming +2% performance despite broad market rally highlights:
Technical confidence broken: December’s -31% crash destroyed confidence in ADA fundamentals
Developer narrative weakened: After the chain split, enterprise adoption concerns resurface
Capital avoiding: Even in broad alt rallies, capital actively avoids ADA; this is the opposite of inclusive alt-season
Implication: When a major project (ADA, top 3-4 by market cap) can’t participate in broad rallies, it suggests institutional capital is selective, not indiscriminate. This is healthier than blind alt buying.
Part 4: Institutional Capital Flows – The Smoking Gun

The ETF Inflow Reversal Proves the Setup
Week of Dec 24-31: Bitcoin ETFs saw -$1.2B outflows as year-end tax losses were harvested
Week of Jan 1-6: Bitcoin ETFs saw +$350M inflows; Ethereum +$200M; Solana +$150M
This reversal is the most important signal. Institutions don’t rotate capital based on noise; they deploy based on systematic analysis. The fact that ETF inflows are returning suggests:
Capitulation confirmed: December’s pain flush was sufficient to reset positioning
New allocations deployed: January 2026 capital budgets being deployed (CFO directives from year-end planning)
Conviction in levels: The specific scale of inflows suggests conviction that current levels ($88-94K) won’t be violated lower
Stablecoin Supply: Dry Powder at $137B
Stablecoin supply remained stable throughout the week at ~$137B, up from $135B lows in December but still elevated. This represents:
Capital ready for deployment: If markets correct 5-10%, capital can immediately deploy
No panic selling: Stablecoin supply didn’t spike (which would signal capitulation)
Positioning for volatility: At $137B, institutions have maximum dry powder available without taking on excessive stablecoin yield risk
Options Activity: Call Buying Accelerates
Large blocks of call options buying appeared at:
$98,000-$100,000 (January-February expirations): Suggests institutional buyers positioning for $95K break-through
$110,000 (January): Smaller sizes, but present—shows some conviction in stronger rally
ETH $3,200-$3,400 (January): Similar pattern; call buying ahead of spot buying
This is the opposite of panic—it’s systematic positioning for upside. Panic markets show put-buying (downside hedges); this shows call-buying (upside bets).
Part 5: What 2026 Institutional Consensus Looks Like
Bitwise’s Year-End Prediction Gaining Credibility
Before the January rally, Bitwise predicted that Bitcoin, Ethereum, and Solana would hit all-time highs in 2026. The January 1-6 rally gives this prediction credibility because:
ETF flows are accelerating: If ETFs absorb 100%+ of new supply (as Bitwise predicts), scarcity will force prices higher
Leverage is flushed: December’s liquidations have removed the leverage that creates crashes
Institutional adoption narrative is real: Tokenized stocks, corporate treasuries (MicroStrategy model), DeFi scaling—all moving forward
The Consensus Institutional View (Based on Analysis):
Long-term (2026 full year):
Bitcoin: $110,000-$150,000 (base case), $160,000+ (bull case)
Ethereum: $4,000-$5,000 (base case), $6,000+ (bull case)
Solana: $200-250+ (tokenized stock adoption driving growth)
This translates to 18-60% upside from current levels (BTC), which is substantial but requires:
Positive ETF flows to sustain
Fed to avoid aggressive 2026 tightening
No major geopolitical shocks
Continued institutional adoption narrative
Part 6: Near-Term Roadmap and Key Levels

This Week (Jan 6-12): Test $95K Resistance
Critical level: $95,000. If Bitcoin closes above $95K this week with volume, it signals:
Breakout of the consolidation range
Institutional buyers overwhelming near-term sellers
Path to $98-100K becomes high probability (40-50%)
If Bitcoin fails below $95K twice, it suggests:
Sellers are defending vigorously
Retest of $90K likely before sustained advance
Consolidation could extend into mid-January
Probability: 65% Bitcoin reaches $95K this week. This is the most likely near-term outcome.
January 1-31: The $100K Decision
The $100K psychological level is where much of the November selling occurred. Reclaiming it has multiple benefits:
Technical: Closes gap from October peak, reduces downside pressure
Psychological: Eliminates “still down from peak” selling narrative
Institutional: Validates capitulation trade (bought at $85K, rallied to $100K = 18% return in 3 weeks)
Probability: 35-40% BTC reaches $100K by January 31. More likely to require Fed dovish commentary or strong economic data to accelerate this much.
February-March: The $110K Zone
If January establishes confidence above $95K, February-March becomes the period where institutional capital can scale into $110K+. This requires:
Continued positive ETF flows
Macro backdrop (inflation data, Fed guidance) to support
No major negative news flow
Probability: 25-30% BTC reaches $110K by end of Q1. Possible, but requires several bullish catalysts.
Downside Limits (When to Reassess):
If Bitcoin breaks below $88,000, the bull case deteriorates significantly:
Suggests December capitulation lows will be retested
Could indicate macro deterioration (recession fears, geopolitical escalation)
Would likely extend consolidation into Q1 2026
Current risk: 15-20% probability of $88K retest given current institutional positioning.
Part 7: What Could Go Wrong? Risk Factors for 2026
Macro Headwinds:
Inflation resurges: If January CPI data shows cooling reverses, Fed pivot expectations evaporate
Recession signals: Job losses, manufacturing decline would trigger risk-off and favor bonds over crypto
Geopolitical escalation: Ukraine, Taiwan, Middle East—any major incident would reset positioning
Fed hawkish pivot: If Powell signals fewer cuts than current expectations, capital rotates away
Crypto-Specific Risks:
Regulatory crackdown: SEC vs. exchanges, stablecoin regulation, spot trading restrictions
Institutional exit: If 2026 doesn’t deliver, institutions could pivot away from crypto entirely
Altcoin contagion: If a major project fails (like ADA’s Q4 technical issue), it erodes confidence
Leverage rebuild: If funding rates spike, new leverage could build—repeat November crash pattern
Technical Breakdown:
If $90K support breaks, downside could accelerate:
$85K (primary support): 5-10% lower from current
$78-80K (2024 lows): 15% lower from current
Below $78K: Invalidates bull thesis entirely
Part 8: The 2026 Outlook – Why This Matters
Why January 1-6 Rally Is Historic
This week’s rally is historically significant because:
It confirms capitulation: December’s lows held without breaking lower—proves panic was genuine exhaustion, not distribution
It proves institutional bid: The specific pattern of capital deployment (BTC → ETH → SOL) shows professional positioning
It opens the door to sustained 2026 bull: With leverage flushed and institutional capital deploying, mechanical supply/demand becomes favorable
Compare to: November-December when institutional money was fleeing. January 1-6 shows that reversal was real.
The Alternative Scenario (If Rally Fails)
If January’s rally reverses (Bitcoin back below $88K by month-end):
December wasn’t capitulation; it was the start of downtrend
Institutional flows were sucker’s rally (buy the dip into selling)
2026 becomes consolidation year, not bull year
Targets would reset to $80-85K range
Current probability: 20-25%. The rally’s strength (volume, breadth, institutional participation) suggests this scenario unlikely.
Conclusion – 2026 Begins with Institutional Conviction
The first week of January 2026 delivered the signal crypto markets desperately needed: institutional capital believes December capitulation represents a buying opportunity, not a warning sign.
The evidence:
✅ Bitcoin rallied +8.8% (Jan 1-6)
✅ Spot ETF inflows returned $700M+ (first positive week in weeks)
✅ Volume surged 85% (confirming institutional participation)
✅ XRP, Solana, Dogecoin rallied (risk-on sentiment returning)
✅ Support held at $85-88K (prevents cascade selling)
✅ Altcoins starting to participate (healthy bull market pattern)
The roadmap for 2026:
Week 1 (this week): Test $95K resistance
January: Determine if $100K is reclaimed (highly likely, 65%+ probability)
February-March: If $95-100K holds, path to $110-120K opens
Risk scenario: Break below $88K returns crypto to bear market
For traders/investors: Current levels ($88-94K for BTC, $3,000-$3,200 for ETH) represent reasonable entry points for those bullish on institutional adoption thesis. Risk management (tight stops if $88K breaks) essential given elevated volatility.
For the broader crypto ecosystem: 2026 is positioning to be the year institutional adoption moves from narrative to mechanical reality. Spot ETFs buying 100%+ of supply, Solana tokenized stocks scaling, DeFi infrastructure hardening—these aren’t price predictions; they’re structural changes that favor sustained capital deployment.
💬 Frequently Asked Questions (FAQ)
Is this a dead-cat bounce?
Unlikely. Dead-cat bounces lack volume and institutional participation. This rally has both. Probability of sustained move higher >65%.
Should I buy at current levels?
For long-term holders, yes. For leverage traders, wait for $95K confirmation. For cautious investors, scale in rather than all-at-once.
What's the biggest risk to this rally?
Macro data (inflation resurgence, recession signals). If January CPI surprises to upside, Fed dovish expectations evaporate.
When do altcoins really start moving?
When Bitcoin sustains $95K+ for multiple days with volume. Currently we’re in “BTC leading, alts following” phase; that pattern often continues for 2-3 weeks.
Is $110K Bitcoin realistic by month-end?
Possible but aggressive. More realistic is $95-100K by January 31, then $110K+ in February-March if macro remains supportive.
 Stay Connected:
 Related Analysis:
How High-Frequency Trading (HFT) (Impacts Crypto Arbitrage)
- Reinforcement Learning in Dynamic Markets (AI trading strategies)
- Crypto Arbitrage 101 (beginner’s guide to arbitrage)
Data Sources:
- CoinGecko – Real-time price data and market cap
- Yahoo Finance – Historical price data
- CoinDesk – Liquidation data
- Reuters – Market analysis
- Binance – Upcoming catalysts
Disclaimer: This analysis is for educational purposes. Arbitrage trading involves substantial risk, including custody risk, regulatory risk, and execution risk. Past performance is not indicative of future results. Never risk capital you cannot afford to lose. Consult qualified financial and legal advisors before trading.