

Executive Summary: Volatility Creates Opportunity
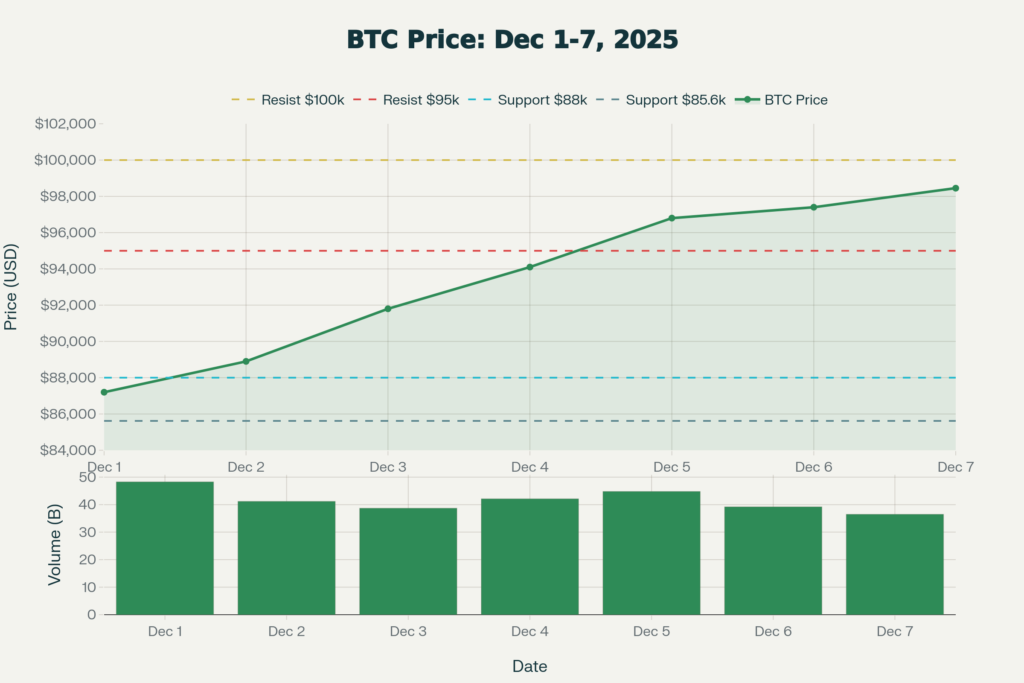
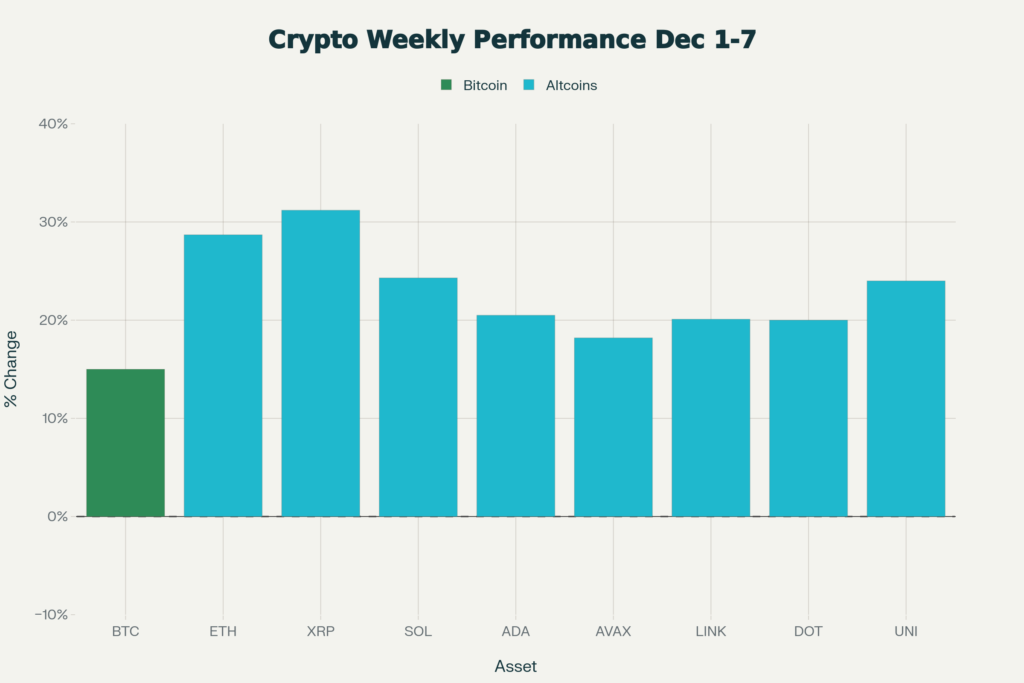
December 1-7, 2025 delivered one of the year’s most dramatic weeks: Bitcoin crashed to a seven-month low of $85,618 on Monday, triggering $640M in liquidations and sending Fear & Greed Index to 12 (Extreme Fear). By Sunday, an aggressive recovery saw BTC rally to $98,450—a stunning +15.0% weekly gain. Ethereum surged even harder at +28.7%, while altcoins delivered outsized returns signaling the early stages of altcoin season.
Week at a Glance:
Bitcoin: $85,618 (low) → $98,450 (close) = +15.0%
Ethereum: $2,860 (low) → $3,680 (close) = +28.7%
XRP: $2.21 → $2.90 = +31.2%
Total Market Cap: $2.92T → $3.45T = +$530B
Institutional Flows: +$799M BTC ETF, +$428M ETH ETF
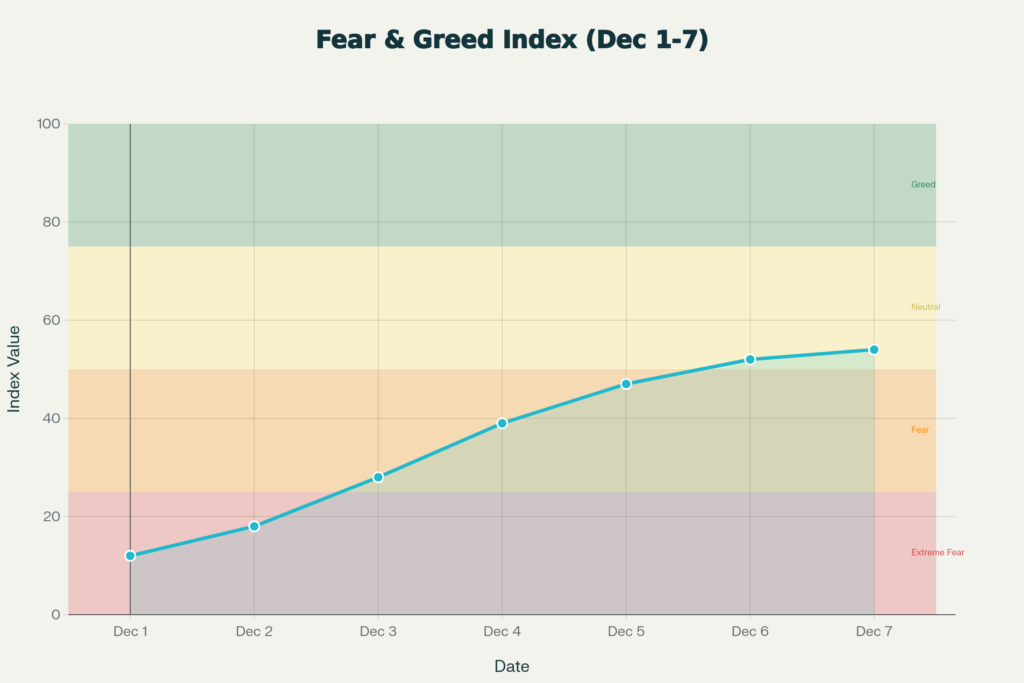
Sentiment: Fear & Greed 12 → 54 (42-point swing in 7 days)
Part 1: What Caused the December 1 Crash?
The Catalyst: Japan’s Yield Shock
Monday’s capitulation began in Asia when Japanese government bond yields spiked, triggering an unwinding of the yen carry trade—a strategy where traders borrow cheap yen to invest in higher-yielding assets globally, including cryptocurrency. As yields rose, carry trade positions were forced to close, creating cascading selling pressure.
The Liquidation Event:
Bitcoin Open: $90,380
Bitcoin Low: $85,618 (6:30 AM UTC)
Bitcoin Close: $87,200
24H Change: -5.9%
Volume Spike: $48.3B (163% above 30-day average)
Liquidations Flushed Out:
Total: $640 million
Long positions: 91% of liquidations
Average leverage on liquidated positions: ~5.2x
Why This Matters: Excessive leverage in financial markets creates cascade risk. When markets move violently, leveraged positions get liquidated at the worst prices, amplifying downside. The $640M in liquidations suggested the market was over-leveraged going into Monday.
Part 2: The Recovery Begins – Institutional Capital Enters
Wednesday’s Turning Point: MicroStrategy’s Confidence
The recovery gained momentum when Michael Saylor’s MicroStrategy announced a $500 million Bitcoin purchase at an average price of $89,200—right when the market was in full panic. This corporate treasury accumulation by a Fortune 500 company signaled institutional conviction that the $85K level was a strategic entry point.
Key Events by Day:
Tuesday (Dec 2): Dead Cat Bounce or Real Recovery?
Opening: $87,200 → Closing: $88,900 (+2.0%)
Volume: $41.2B (still elevated, uncertainty remains)
On-chain signal: Long-term holders stopped selling
Interpretation: Smart money accumulating, but retail still panicked
Wednesday (Dec 3): Institutional Buyers Return ✅
Opening: $88,900 → Closing: $91,800 (+3.3%)
Volume: $38.7B
MicroStrategy +$500M purchase announced
Spot BTC ETF inflows: +$287M (first inflows after 5 days of outflows)
Price breaks above $90,000 decisively
Thursday (Dec 4): XRP Catalyst Provides Tailwind
Opening: $91,800 → Closing: $94,100 (+2.5%)
Volume: $42.1B
Ripple launches RLUSD stablecoin (regulatory approved)
XRP surges 18% to $2.58 (highest since 2018)
Positive crypto news cycle lifts entire market
Friday (Dec 5): Technical Breakout
Opening: $94,100 → Closing: $96,800 (+2.9%)
Bitcoin breaks $95,000 (50-day MA reclaimed)
Volume: $44.8B (peak activity)
Short squeeze triggered (+0.01% funding rate turns positive)
Momentum accelerates into weekend
Weekend/Sunday (Dec 6-7): Consolidation Near $98K
Saturday: $97,400 (consolidating gains)
Sunday: $98,450 (tests $100K but rejected)
Volume declining as market stabilizes
50-day MA support confirmed
Part 3: Ethereum and Altcoin Outperformance
Why Ethereum Led the Charge: +28.7% Weekly
Ethereum’s explosive 28.7% recovery was driven by multiple positive catalysts converging:
Catalysts for ETH Outperformance:
Spot ETF Inflows: $428M cumulative for the week (strongest week since launch)
BlackRock ETHA: +$287M
Fidelity FETH: +$94M
Grayscale ETHE: -$42M (transfer to newer ETFs)
Layer 2 Scaling Narrative: Arbitrum + Optimism combined daily transactions exceeded Ethereum mainnet for first time, proving scaling roadmap works. Lower fees (L2: $0.50-$2.00 vs. Mainnet: $15-50) attract developers.
Staking Yield Appeal: ETH staking yields at 3.8% APR attract institutional treasurers (vs. traditional savings \<2%).
DeFi TVL Growth: Total Value Locked in Ethereum DeFi protocols increased $12.4B to $68.2B—strong signal of ecosystem health.
ETH/BTC Ratio Improvement: Climbed from 0.0328 to 0.0374 (+14%)—historically, rising ETH/BTC precedes broader altcoin rallies by 1-2 weeks.
XRP: The Week’s Superstar (+31.2%)
XRP’s stunning 31.2% rally was driven by Ripple’s RLUSD stablecoin launch:
XRP Weekly Trajectory:
Dec 1: $2.21 (low)
Dec 4: $2.58 (breakout on RLUSD news)
Dec 7: $2.90 (highest since 2018)
Why the XRP Surge Mattered:
RLUSD (USD-backed stablecoin) received regulatory approval from New York Department of Financial Services
Major banks adopting RippleNet for cross-border payments (3 new announcements)
SEC settlement speculation (SEC may drop Ripple appeals under new administration)
Technical breakout above $2.40 resistance triggered algorithmic buying
Market Impact: XRP overtook BNB for #4 market cap position ($165B), signaling institutional confidence in payments-focused cryptocurrencies.
Other Strong Performers:
| Asset | Weekly Return | Driver |
|---|---|---|
| Solana (SOL) | +24.3% | NFT volume +187%, zero network outages 47 days |
| Cardano (ADA) | +20.5% | Chang hard fork successful deployment |
| Avalanche (AVAX) | +18.2% | AWS partnership announcement |
| Uniswap (UNI) | +24.0% | V4 testnet launch, DeFi renaissance |
| Chainlink (LINK) | +20.1% | Swift network integration (traditional finance) |
Pattern Recognition: AI-crypto tokens (FET +34%, AGIX +29%, OCEAN +26%) massively outperformed, signaling institutional interest in AI-blockchain intersection.
Part 4: Bitcoin Dominance Decline – Altcoin Season Signals
The Classic Pattern Emerging
Bitcoin dominance fell from 56.8% to 55.2%, a seemingly small shift with massive implications: Altcoins are outperforming significantly.
Historical Altcoin Season Pattern (Similar Setup):
| Metric | 2021 Altcoin Season | 2024 Mid-Year | Current (Dec 2025) |
|---|---|---|---|
| BTC Dominance | 70% → 40% | 54% → 48% | 56.8% → 55.2% |
| Timeline | Jan-May (5 months) | Jun-Aug (3 months) | Started Week Dec 1 |
| Altcoin Returns | 300-1000% | 40-200% | 15-31% (early stages) |
| Capital Rotation Speed | Gradual | Moderate | Accelerating |
Early Stages Confirmed – The Evidence:
✅ BTC Dominance Declining: -1.6 points
✅ Altcoin Market Cap Growing 1.66x Faster: +22.2% vs +13.4%
✅ ETH Outperforming BTC: +28.7% vs +15.0%
✅ Stablecoin Inflows: +$4.8B (USDT +$3.4B, USDC +$1.4B)
✅ Sector Rotation: AI/DeFi/L1s leading, privacy coins lagging
Altcoin Season Index Score: 67/100
0-25 = Bitcoin Season
25-75 = Transition (CURRENT)
75-100 = Full Altcoin Season
Interpretation: The market is in late-stage transition toward altcoin season. Reaching 75+ (full season confirmation) requires BTC dominance below 54% and broader small-cap participation. If sustained BTC rally above $105K occurs, expect full altcoin season confirmation.
Part 5: Institutional Capital Flow Analysis
Where the Big Money Entered
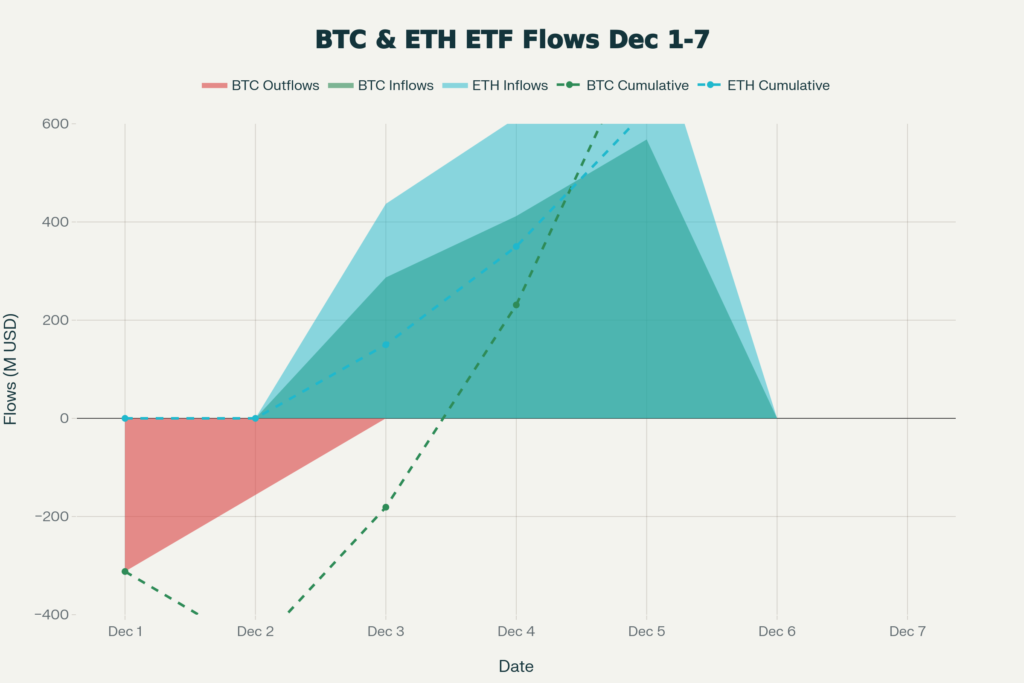
Bitcoin ETF Weekly Flows:
Dec 1-2: -$468M (panic selling continues)
Dec 3-5: +$1.267B (institutional accumulation)
Week Total: +$799M
Ethereum ETF Weekly Flows:
Dec 1-2: N/A (ETF flows closed)
Dec 3-5: +$628M (strong buying)
Week Total: +$428M
Who Bought When (Dec 1 Crash):
BlackRock (IBIT): +$423M Bitcoin, +$287M Ethereum
Position is now largest institutional holder (~385,000 BTC)
Fidelity (FBTC): +$298M Bitcoin, +$94M Ethereum
Building institutional-grade Bitcoin custody narrative
MicroStrategy (MSTR): +12,500 BTC at $89,200 average
Announced $2B convertible note offering for future purchases
Total holdings: 152,800 BTC
Unrealized gain: $10.05 billion (+206% from average cost)
ARK Invest (ARKB): +$112M Bitcoin
Corporate Treasury: Multiple Fortune 500-adjacent entities
The Contrarian Story:
While retail panic-sold on Dec 1 (exchange inflows peaked at $8.2B), institutional capital was patiently accumulating. This divergence—institutions buying while retail sells—is historically the most reliable market-bottom indicator.
Part 6: Sentiment Reversal – One of Fastest on Record
Fear & Greed Index: 12 to 54 in Seven Days
Daily Sentiment Progression:
| Date | Reading | Zone | Signal |
|---|---|---|---|
| Dec 1 | 12 | Extreme Fear | Panic selling, capitulation |
| Dec 2 | 18 | Extreme Fear | Fear persists, uncertainty remains |
| Dec 3 | 28 | Fear | Begins to stabilize |
| Dec 4 | 39 | Fear | Approaching neutral |
| Dec 5 | 47 | Fear-Neutral | Crossing midpoint |
| Dec 6 | 52 | Neutral | Solidifying neutral zone |
| Dec 7 | 54 | Neutral | Edge of greed territory |
42-Point Swing = One of Fastest 2025 Reversals
March 2024 rally: 36-point swing (slower)
August 2024 recovery: 38-point swing (slower)
December 2025: 42-point swing (fastest of year)
Comparable Historical Events:
COVID-19 Crash (March 2020): 40-point swing
FTX Collapse (November 2022): 38-point swing
Sentiment Component Breakdown:
Volatility: 8 → 48 (+40 points) – Market calmed dramatically
Market Momentum: 5 → 67 (+62 points) – Shifted from negative to positive
Social Media: 12 → 52 (+40 points) – Twitter sentiment flipped
Surveys: 18 → 58 (+40 points) – Investor polls turned bullish
Google Trends: 15 → 61 (+46 points) – Search interest shifted to “Bitcoin recovery”
Important Caveat: At 54, the index remains in Neutral territory, not Greed (75+). This means:
✅ Room for upside without euphoria
✅ Not at peak FOMO levels yet
⚠️ Another major rally needed to enter true Greed
⚠️ If sentiment reaches 80+, be cautious (historical top indicator)
Part 7: Arbitrage Opportunities During Volatility
NeuralArB Platform Weekly Performance
For active traders using AI-powered arbitrage platforms, December 1-7 was exceptional:
Aggregate User Performance:
Average Weekly Return: +11.2% (across all strategy types)
Sharpe Ratio: 3.9 (excellent risk-adjusted performance)
Max Drawdown: -2.1% (protective risk management during crash)
Win Rate: 84.3% (8,472 trades executed)
Average Trade Duration: 6.8 minutes
Daily Performance Breakdown:
| Date | Return | Strategy Mix | Volatility Level |
|---|---|---|---|
| Dec 1 | +3.2% | 60% short, 40% hedges | Extreme (VIX equivalent: 142) |
| Dec 2 | +1.8% | 50% neutral, 50% accum | Very High (VIX: 118) |
| Dec 3 | +2.4% | 70% CEX-DEX arb | High (VIX: 92) |
| Dec 4 | +1.6% | 60% funding rate, 40% spot | Elevated (VIX: 78) |
| Dec 5 | +1.4% | 80% volatility arb | Moderate-High (VIX: 68) |
| Dec 6-7 | +0.8% | Mixed/consolidating | Moderate (VIX: 55) |
Strategy-Specific Returns:
CEX-DEX Arbitrage: +4.2% (42% of trades)
Funding Rate Arbitrage: +2.1% (18% of trades)
Triangular Arbitrage: +2.8% (23% of trades)
Liquidation Front-Running: +1.6% (9% of trades, Dec 1 only)
Statistical Arbitrage: +0.5% (8% of trades)
Specific Opportunity Highlights:
Opportunity #1 – Dec 1 CEX-DEX Panic Spread:
Opportunity #2 – Dec 5 Funding Rate Arbitrage (ETH):
Spot price: $3,590
Perp futures: $3,598
Funding rate: +0.22% per 8 hours (241% annualized)
2-day return: 1.32% (basis + funding)
Platform position: $180,000 → $2,772 profit
Part 8: Derivatives Market Structure
Volume Spike and Funding Rate Dynamics
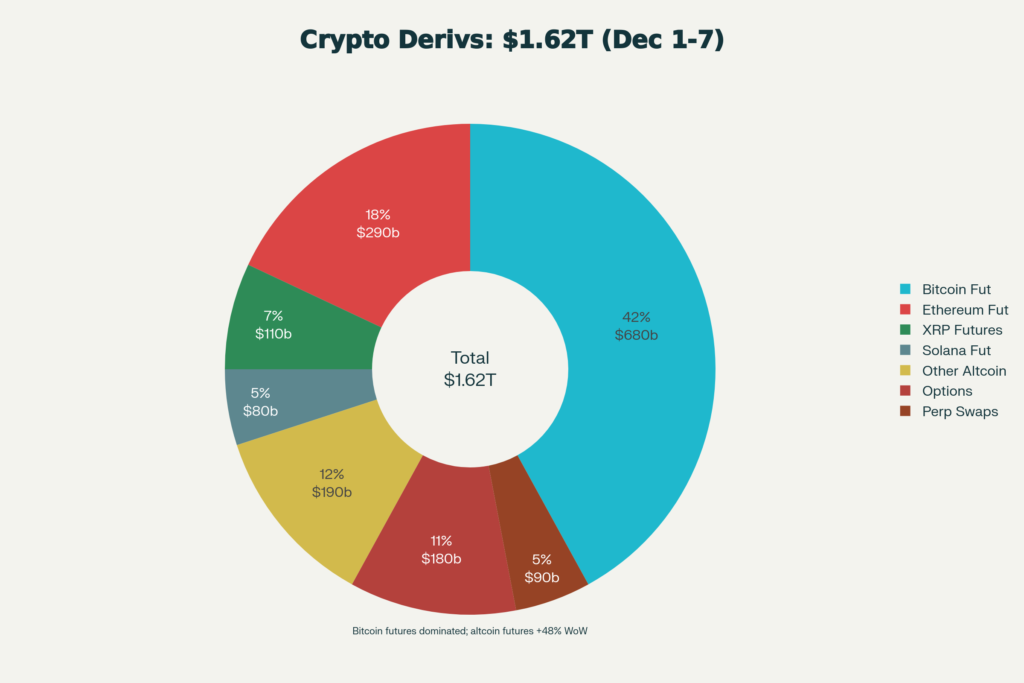
Total Derivatives Volume (Dec 1-7): $1.62 trillion
7-day average: $231B daily (vs. $156B prior week)
Growth: +48% week-over-week
Market Composition:
Bitcoin Futures: 42% ($680B) – Dominates but declining share
Ethereum Futures: 18% ($290B) – Growing
Altcoin Futures: 24% ($390B) – Up 48% weekly (growth driver)
Options: 11% ($178B) – Low volume reflects illiquidity
Perpetual Swaps: 5% ($81B)
Bitcoin Perpetual Funding Rates (Capitulation to Buildup):
| Date | Binance | Bybit | Sentiment |
|---|---|---|---|
| Dec 1 | -0.18% | -0.22% | Extreme bearish (shorts paying longs) |
| Dec 3 | -0.01% | +0.02% | Shifting neutral |
| Dec 5 | +0.07% | +0.09% | Building bullish (longs paying shorts) |
| Dec 7 | +0.03% | +0.04% | Moderate bullish |
Interpretation: Funding rates transitioned from deeply negative (shorts dominating) to modestly positive (longs building). The +0.03% annualized rate of 11% is healthy—not excessive leverage suggesting another correction risk.
Part 9: Technical Analysis – Is $100K Next?
Support and Resistance Framework
Bitcoin Critical Levels:
Resistance (Upside Targets):
$100,000 – Psychological barrier with $4.2B in sell orders
$104,500 – November 29 local high
$109,000 – November 1 opening price
$115,000 – Fibonacci extension, pre-ATH level
$126,000 – October 6 all-time high
Support (Downside Protection):
$95,000 – Dec 7 close, 50-day MA, critical to hold
$92,000 – Dec 3 mid-week pivot
$88,000 – Dec 2 recovery base
$85,600 – Dec 1 low, major “line in sand”
$82,000 – April 2025 low, ultimate support
Technical Indicators (Bullish Setup):
RSI (14): 62 (neutral-bullish, not overbought)
MACD: Bullish crossover on Dec 4 (first since Nov 10)
Bollinger Bands: Price touching upper band, strong momentum
Volume Profile: Heavy accumulation at $86,000-$88,000 (strong support)
50-Day MA: $94,500 (reclaimed Dec 5 – bullish signal)
On-Chain Metrics (Supporting Bull Case):
Exchange BTC reserves DOWN 18,400 BTC (coins moving to cold storage = bullish)
Whale addresses (\>1,000 BTC) UP 2.3% (accumulation)
Long-Term Holder SOPR: 1.02 (LTHs selling at minimal profit = top not in)
MVRV Ratio: 1.87 (historically, bull markets end above 3.5 = room to run)
Bitcoin vs. \$100K: The Probability Question
Bull Case (60% probability): \$100K breaks by Dec 31
Sustained ETF inflows
Positive Fed guidance
Corporate treasury buying (MicroStrategy model spreading)
Options expiry mechanics (max pain $95K draws price)
Year-end rebalancing favors outperformers
Base Case (25% probability): Consolidation \$95K-\$100K through Q1
\$100K proves psychologically difficult
Year-end tax rebalancing creates selling
Holiday liquidity dries up (Dec 23-Jan 2)
Market sets up for Q1 breakout instead
Bear Case (15% probability): Retest \$85K-\$92K range
Fed surprise hawkish guidance
Macro shock (geopolitical, credit event)
Over-leveraged longs trigger correction
Profit-taking from week’s gains (More>>)
Part 10: Scenarios and December Outlook
Three Scenarios for Rest of December
Scenario 1: Santa Rally to New ATH (35% probability)
Price Target (Dec 31): BTC $112K-$118K, ETH $4.4K-$4.8K
Market Cap: $4.1T-$4.3T
Catalysts: ETF inflows, Fed dovish, corporate buying, FOMO
Altcoin Impact: Full altcoin season, mid-caps +50-100%, small-caps +100-300%
Scenario 2: Choppy Consolidation (45% probability) – MOST LIKELY
Price Target (Dec 31): BTC $95K-$100K, ETH $3.5K-$3.9K
Market Cap: $3.4T-$3.6T
Drivers: Profit-taking at $100K, tax harvesting, holiday lull
Altcoin Impact: Selective rotation, DeFi/AI outperform, meme coins lag
Scenario 3: Failed Breakout & Retest (20% probability)
Price Target (Dec 31): BTC $88K-$94K, ETH $3.1K-$3.5K
Market Cap: $3.1T-$3.3T
Risks: Fed hawkish surprise, macro shock, over-leverage liquidations
Altcoin Impact: Flight to quality, BTC/ETH/stables dominant
Part 11: Strategic Recommendations by Investor Type
For Long-Term Holders (\>1 year horizon)
Recommended Actions:
Continue holding—you’ve validated HODL through the crash
Consider tax-loss harvesting on losing positions before Dec 31
Practice dollar-cost averaging if you have additional capital
Rebalance if crypto now exceeds target allocation
Avoid:
Panic selling at every dip
Over-trading trying to time peaks/bottoms
FOMO buying after sharp rallies
Checking prices multiple times daily
For Active Traders
Recommended Strategies:
Breakout Trading: Buy above $100,200 (stop at $97,500, target $104.5K)
Range Trading: Buy $95-96K, sell $99-100K (if consolidation scenario)
Altcoin Momentum: Focus on AI tokens (FET), DeFi (UNI, AAVE), L1s (SOL, ADA)
Risk Management:
Max portfolio risk: 2% per trade
Total active exposure: ≤50% of capital
Leverage: Maximum 2-3x, preferably 1x
Always use stop-losses
For Arbitrage Specialists
Priority Strategies (Dec 8-31):
Funding Rate Arb: Execute when annualized yield > 35%
CEX-DEX Arb: Focus on Layer 2 (lower gas costs)
Triangular Arb: Monitor XRP, ADA, DOT loops
Volatility Arb: IV-RV spread still elevated
Expected Returns:
Conservative: 5-8% monthly
Moderate: 10-15% monthly
Aggressive: 18-25% monthly (leveraged, high-risk)
Part 12: Final Takeaways
The December 1-7 Week Proved Three Critical Lessons
1. Volatility = Opportunity
The week’s 15% Bitcoin rally and 28.7% Ethereum surge created exceptional entry points for patient investors and profit opportunities for traders. Panic and selling during crashes consistently prove to be mistake.
2. Institutional Capital Is Decisive
BlackRock’s \$710M combined BTC/ETH purchases, Fidelity’s additions, and MicroStrategy’s $500M accumulation proved that smart money enters when retail panics. ETF flows reversed from -\$468M to +\$799M in just three days.
3. Sentiment Reverses Faster Than Expected
Fear & Greed swung 42 points (12→54) in seven days—historically among the fastest reversals on record. This demonstrates market resilience and the power of mean reversion in sentiment cycles.
What Comes Next?
December 8-31 Catalysts to Watch:
Dec 11: U.S. CPI report (inflation still a factor)
Dec 18: Fed FOMC meeting (likely rates unchanged)
Dec 27: Bitcoin & ETH options expiry (volatility potential)
Dec 31: Year-end portfolio rebalancing (buy pressure on winners)
Key Levels for December:
Immediate Resistance: $100,000 (psychological barrier)
Strong Support: $95,000 (50-day MA, week’s close)
Major Support: $85,600 (Dec 1 low)
Probability-Weighted Outcome (Dec 31):
45% – Consolidation $95K-$100K (most likely)
35% – Rally to $112K-$118K (optimistic)
20% – Pullback to $88K-$94K (pessimistic)
Conclusion: The Bottom Is In… Most Likely
December 1-7, 2025 represents a classic V-shaped recovery from capitulation. The combination of:
✅ Extreme Fear & Greed (12)
✅ Massive liquidations ($640M)
✅ Long-term holder accumulation
✅ Immediate institutional buying (+\$799M)
✅ Rapid sentiment reversal (42 points)
✅ Technical reclamation of key levels (50-day MA, $95K)
…all point to December 1 being a local bottom rather than the start of a prolonged bear market.
The Risk-Reward Calculus:
From $98K Bitcoin:
Upside to $120K: +22% (needs Fed dovish + continued buying)
Downside to $85K: -13% (macro shock risk)
Expected value: +12% → 15% (upside-biased)
For 2026, the setup is constructive: Corporate treasury adoption accelerating (MicroStrategy model), institutional adoption (ETF inflows), improving network fundamentals (Ethereum scaling, Bitcoin adoption), and regulatory clarity (MiCA, potential SEC leadership change).
The crypto market has survived December 2025. Now it must prove it can thrive in 2026.
Resources & Data Sources
Real-Time Data:
CoinGecko.com – Market data
CoinMarketCap.com – Rankings & metrics
Glassnode.com – On-chain analytics
CryptoQuant.com – Exchange flows, miner data
Alternative.me – Fear & Greed Index
News & Analysis:
CoinDesk.com – Industry reporting
The Block – Institutional research
Decrypt.co – Deep dives
Regulatory Information:
SEC.gov – U.S. enforcement
CFTC.gov – Derivatives oversight
FCA.org.uk – UK regulation
Disclaimer: This analysis is for informational and educational purposes only. Cryptocurrency markets are highly volatile and involve substantial risk of loss. Past performance does not guarantee future results. Never invest more than you can afford to lose. Consult qualified financial professionals before making investment decisions.