
Crypto Market Update – December 1, 2025: Bitcoin Crashes to $85K as Markets Enter Extreme Fear

Crypto Market Update, December 1, 2025


Market Overview: December Opens with Bloodbath


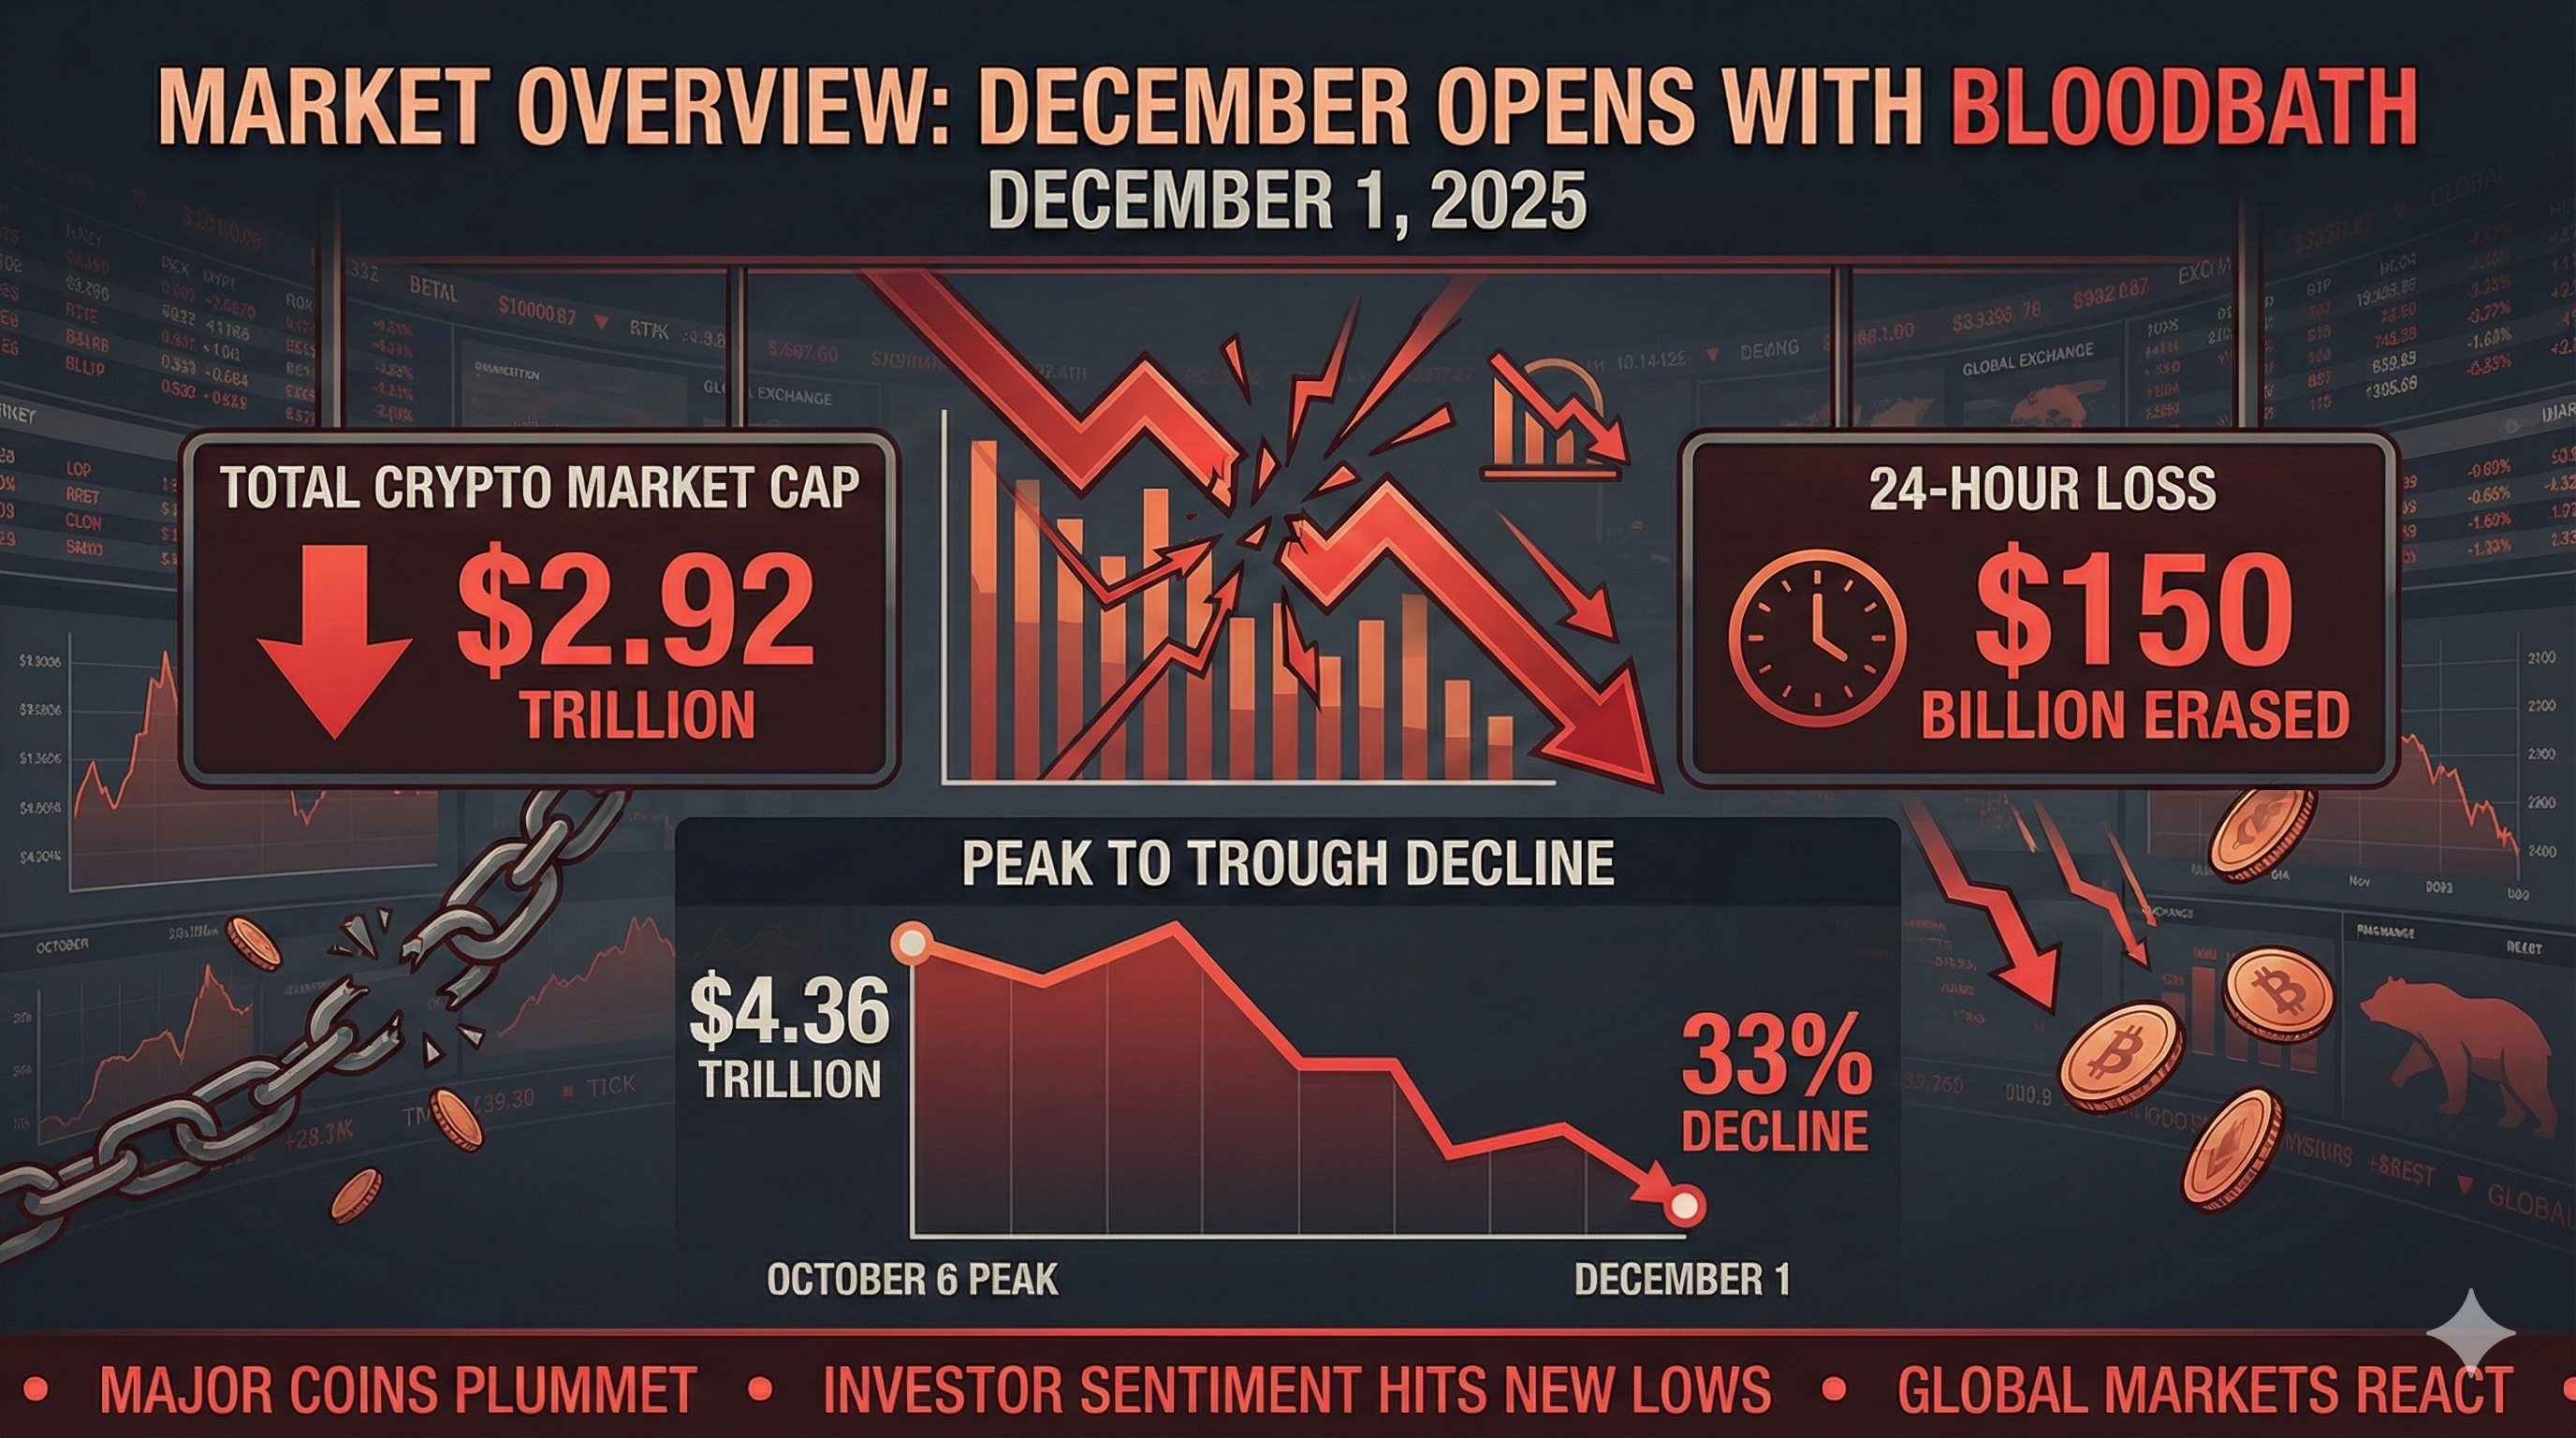
December 1, 2025, marked one of the most violent single-day crashes in recent crypto history. The total cryptocurrency market capitalization plummeted to $2.92 trillion, erasing $150 billion in just 24 hours and marking a 33% decline from the October 6 peak of $4.36 trillion (CoinGecko).
Market Overview: December Opens with Bloodbath

Key Metrics (December 1, 2025):

    • Total Market Cap: $2.92T (-5.2% in 24h, lowest since April 2025)
    • 24H Trading Volume: $147 billion (-12% from previous day)
    • Bitcoin Dominance: 56.8% (down from 58.7% on Nov 10)
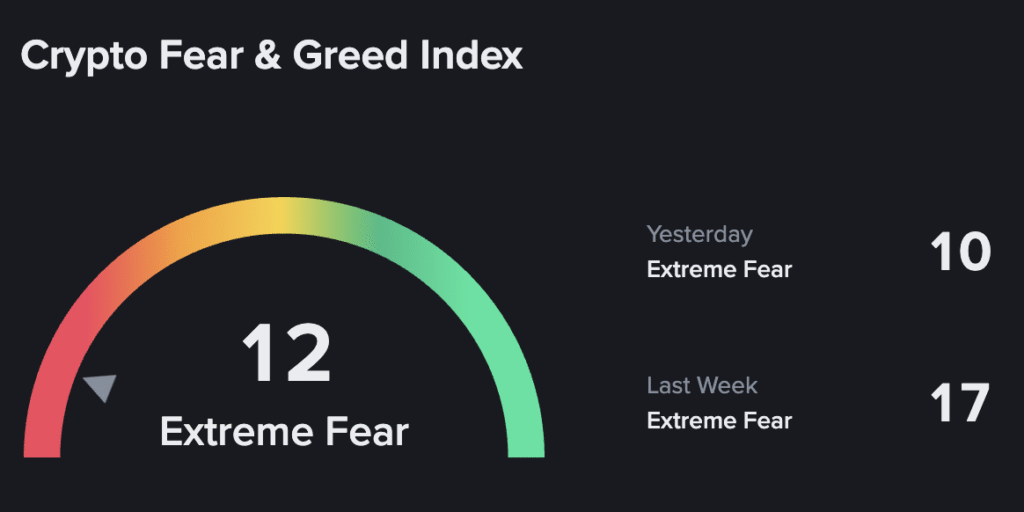
    • Fear & Greed Index: 12 (Extreme Fear) – lowest reading since June 2022
    • Total Liquidations: $640 million in 24 hours
Crypto Fear & Greed Index


Bitcoin: Flash Crash to 7-Month Lows


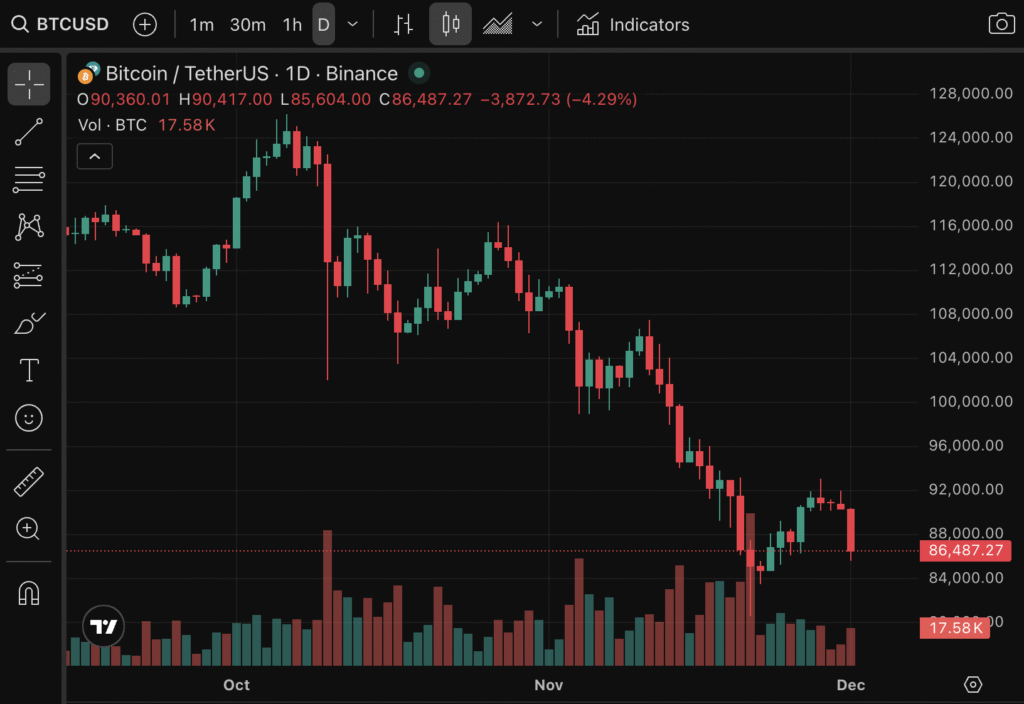
Bitcoin (BTC) experienced a brutal 5.9% single-day decline, crashing from $90,380 to a session low of $85,618 – the lowest price since April 2025. This represents a -33% collapse from the October all-time high of $126,000 (Yahoo Finance).
Bitcoin Price Action:

    • Opening Price (Dec 1): $90,380
    • Session Low: $85,618 (marked 7-month low)
    • Current Price: $86,680 (minor recovery)
    • 24H Change: -5.9%
    • Weekly Change: -6.7%
    • From ATH ($126K): -33%

Market Cap Impact:

    • Bitcoin market cap: $2.23 trillion (down $131 billion in 24h)
    • BTC now accounts for only 56.8% of total crypto market
    • Daily trading volume: $33.3 billion (+42.8% surge due to panic selling)


Ethereum and Major Altcoins: Deeper Losses


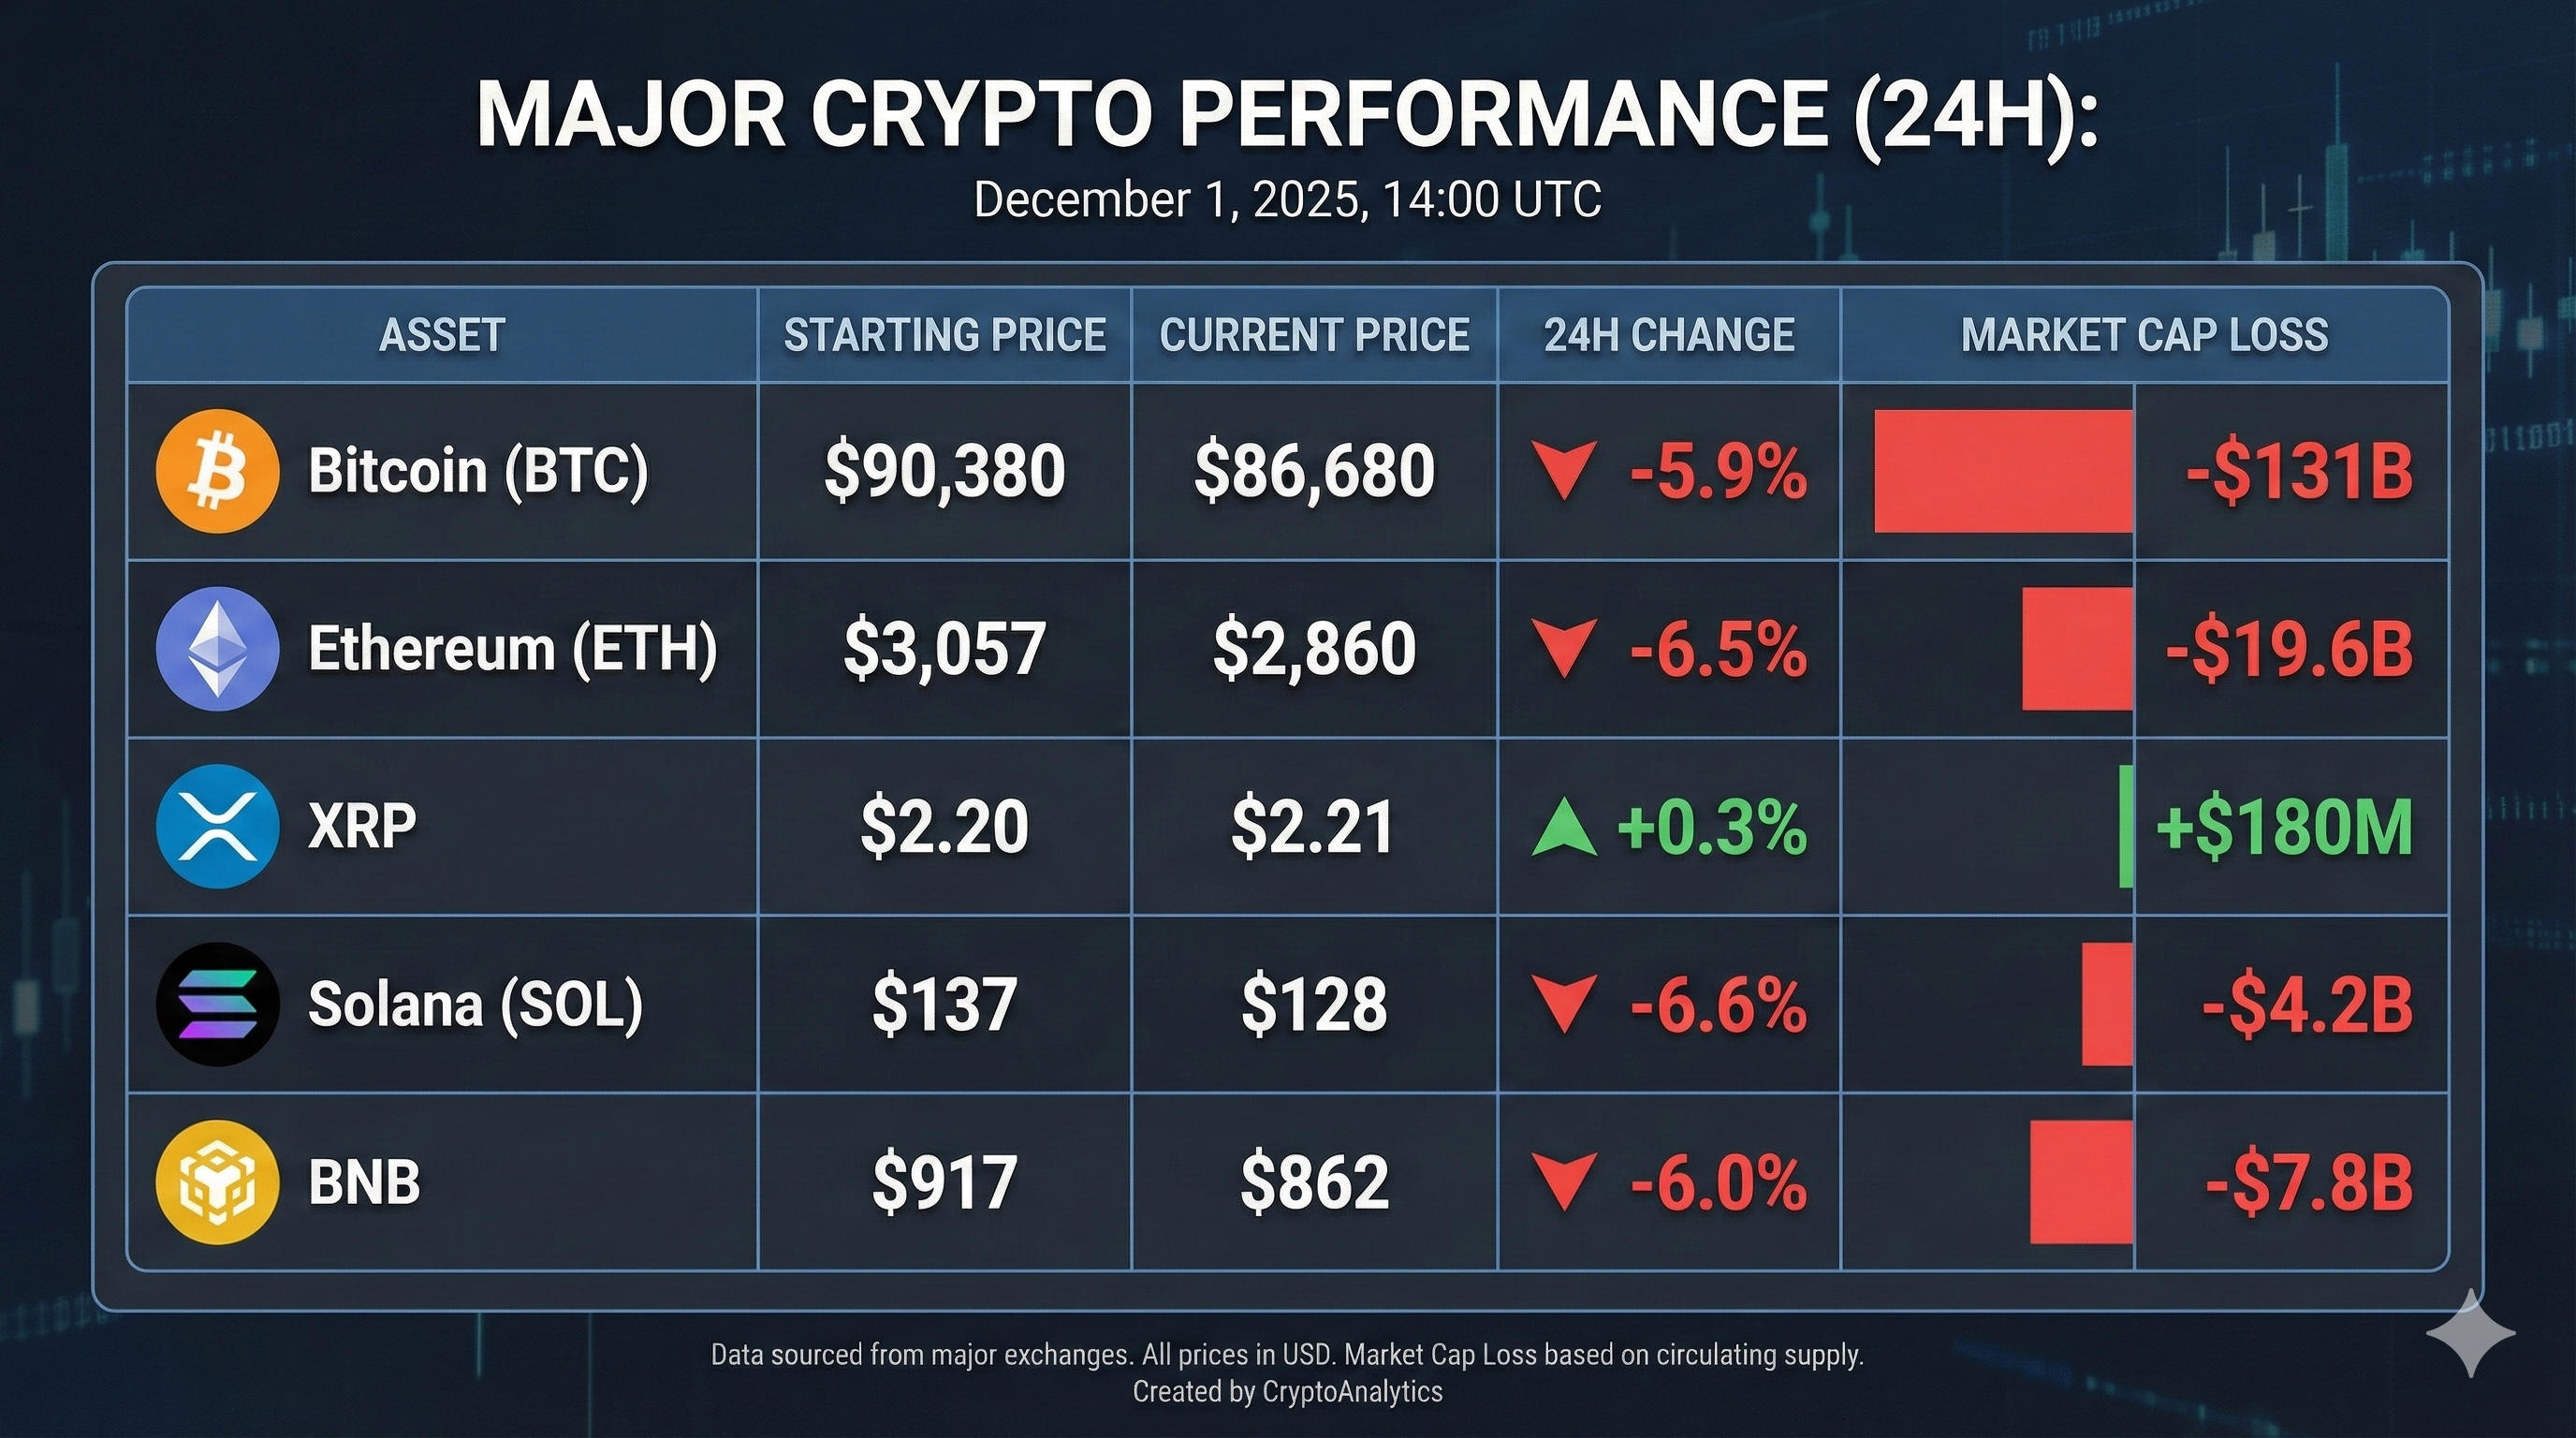
Ethereum (ETH) suffered an even sharper 6.5% decline, falling from $3,057 to $2,860 and breaching critical psychological support at $3,000. XRP emerged as the rare outperformer, gaining 0.3% to $2.21 (CoinDesk).
Major Crypto Performance (24H):

AssetStarting PriceCurrent Price24H ChangeMarket Cap Loss
Bitcoin (BTC)$90,380$86,680-5.9%-$131B
Ethereum (ETH)$3,057$2,860-6.5%-$19.6B
XRP$2.20$2.21+0.3%+$180M
Solana (SOL)$137$128-6.6%-$4.2B
BNB$917$862-6.0%-$7.8B

Altcoin Bloodbath:

    • Mid-cap altcoins suffered 8-12% losses
    • Small-cap tokens plunged 15-25%
    • DeFi tokens particularly vulnerable (AAVE -9.2%, UNI -8.7%, SUSHI -11.4%)
    • Layer-2 solutions hit hard (ARB -10.1%, OP -9.8%)


The Great Liquidation Event: $640 Million Wiped Out


The December 1 crash triggered one of the largest single-day liquidation events of 2025, with $640 million in leveraged positions forcibly closed within 24 hours (CoinDesk).
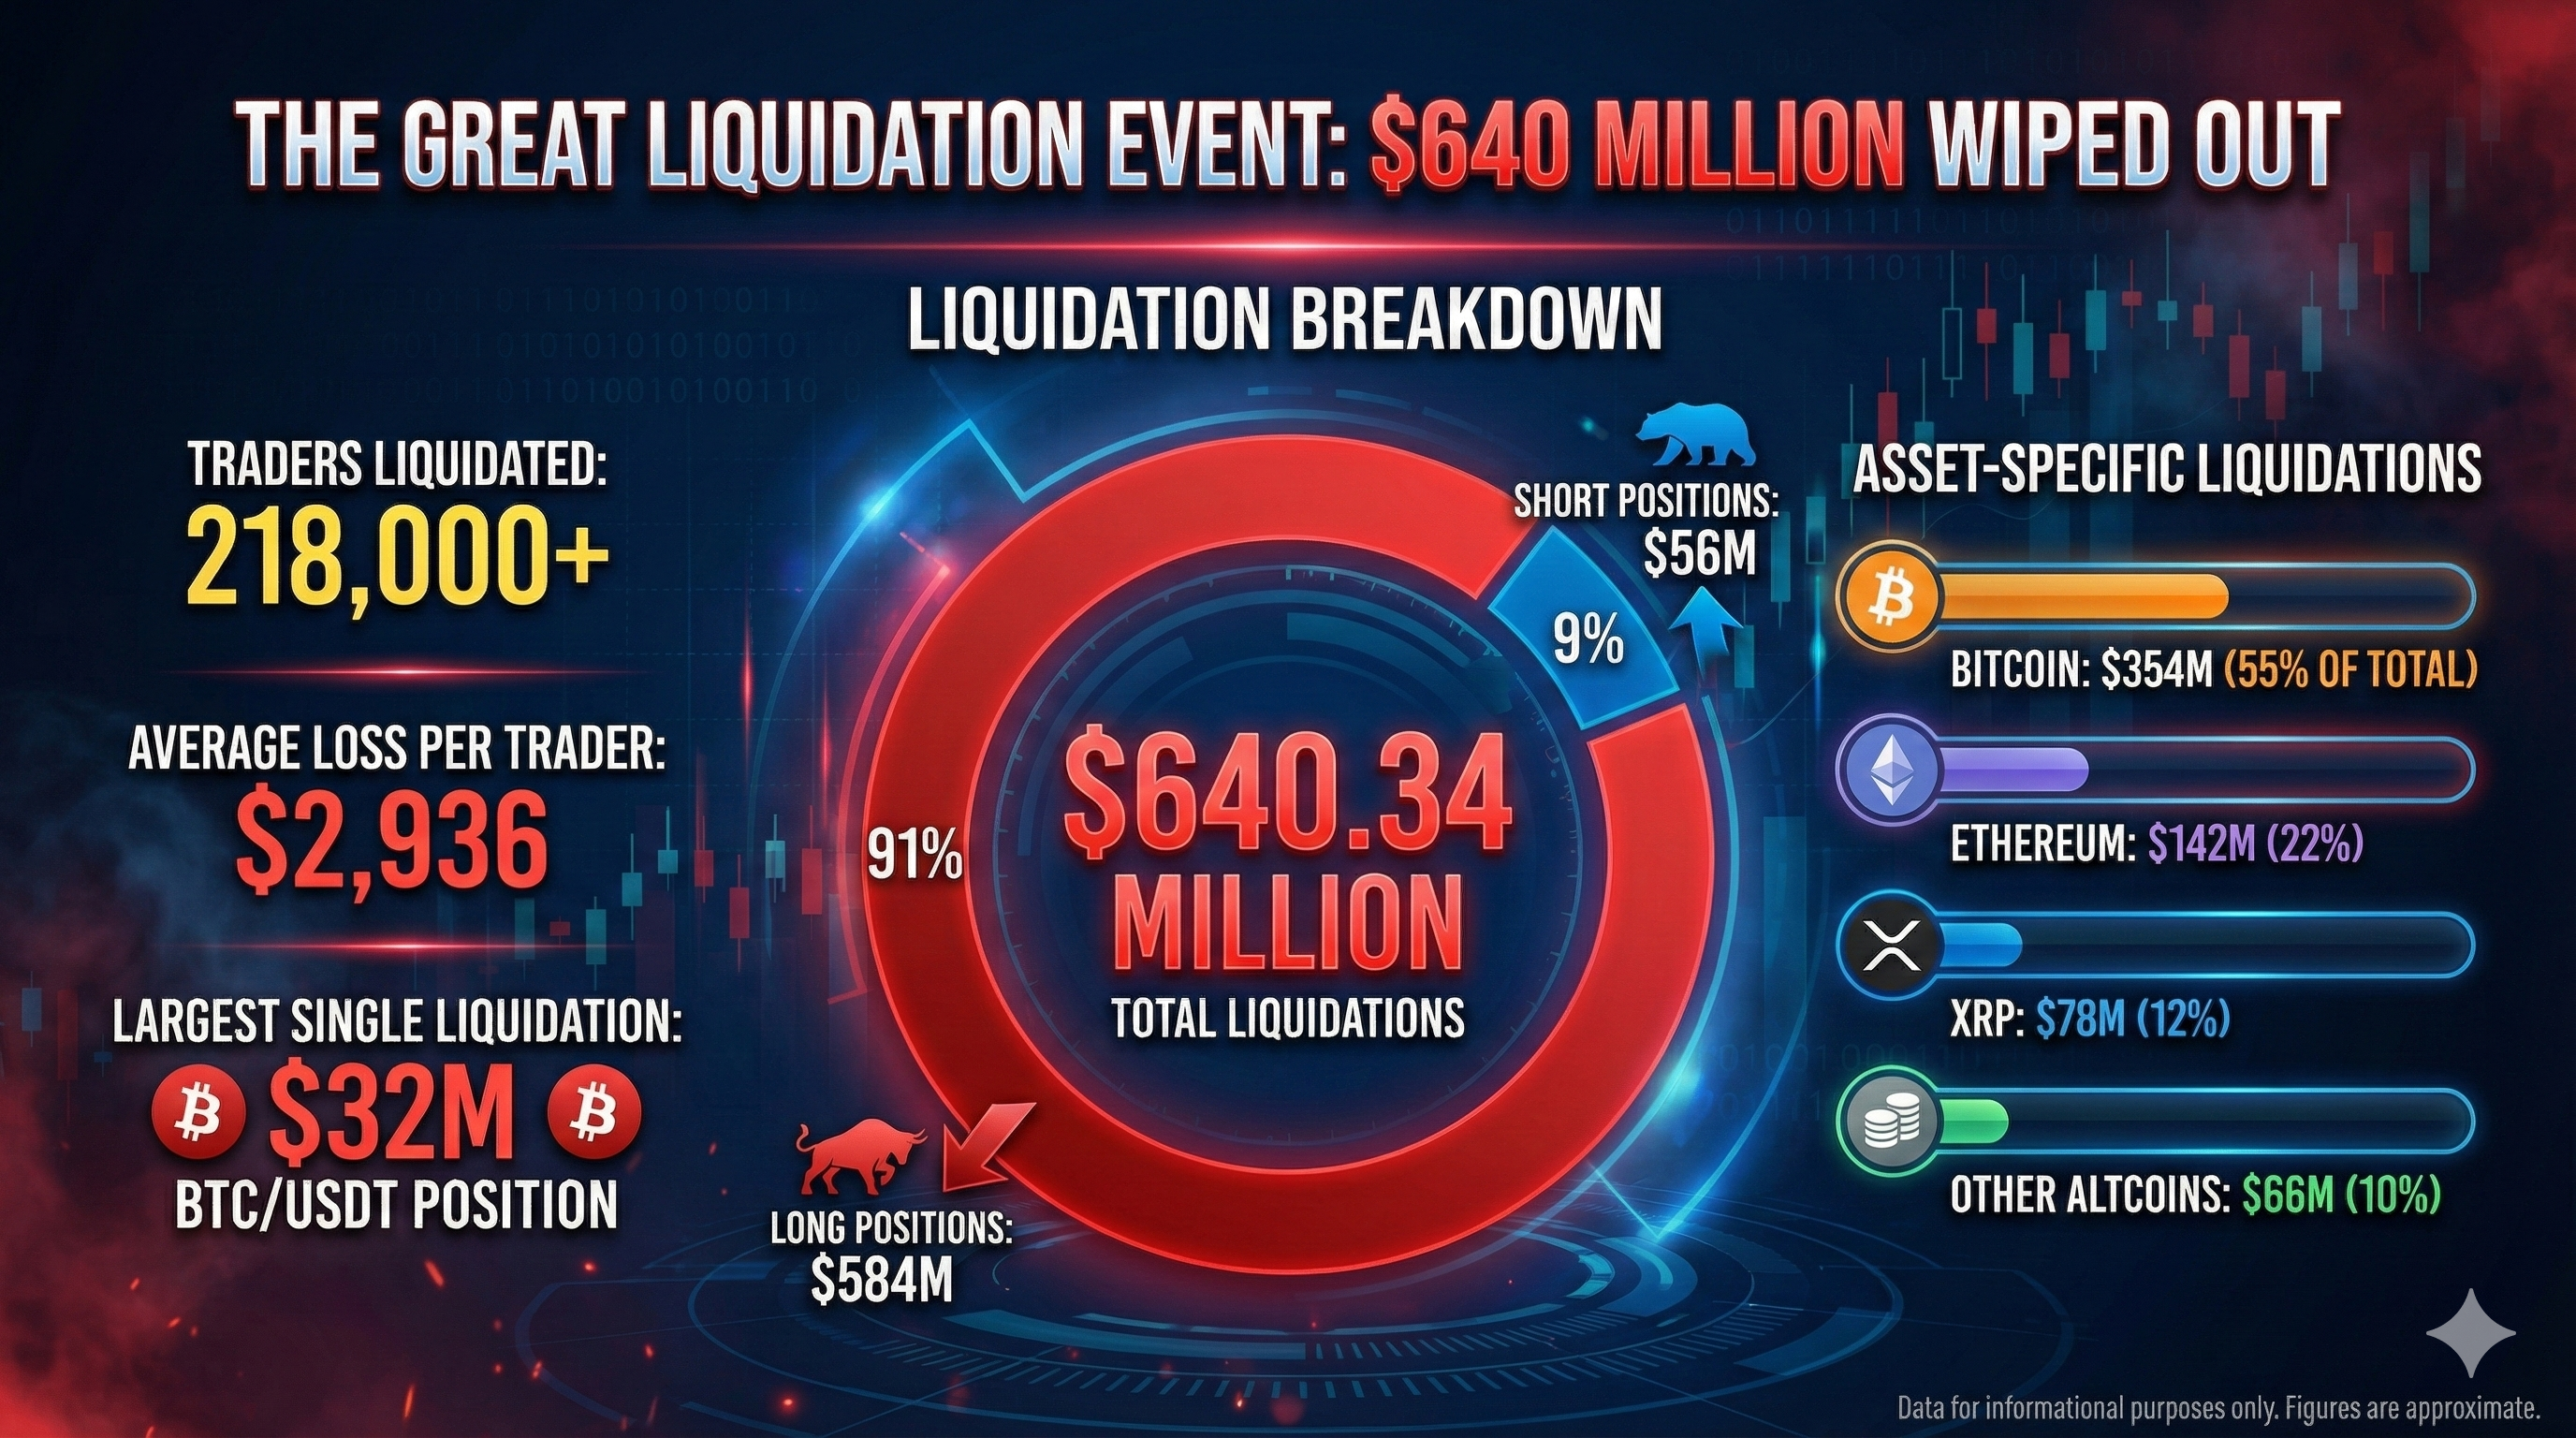
Liquidation Breakdown:

    • Total Liquidations: $640.34 million
    • Long Positions: $584M (91% of total)
    • Short Positions: $56M (9% of total)
    • Traders Liquidated: 218,000+
    • Average Loss Per Trader: $2,936
    • Largest Single Liquidation: $32M BTC/USDT position

Asset-Specific Liquidations:

    • Bitcoin: $354M (55% of total)
    • Ethereum: $142M (22%)
    • XRP: $78M (12%)
    • Other Altcoins: $66M (10%)

The 91% long bias in liquidations indicates most traders were positioned for continued upside, making the crash particularly devastating for leveraged bulls.


Catalysts Behind the December 1 Crash


Multiple factors converged to create a “perfect storm” for the crypto market:


1. Japan Yield Shock

Japanese 10-year government bond yields surged unexpectedly, triggering a yen carry trade unwind. This forced global investors to liquidate risk assets, including crypto, to cover yen-denominated positions (CryptoSlate).


2. Weekend Liquidity Crunch

The crash occurred during early Monday Asia trading with reduced liquidity, exacerbating price swings. Thin order books amplified the selling pressure.


3. DeFi Protocol Hack Fears

Unconfirmed reports of a potential Yearn Finance exploit circulated, creating panic among DeFi users. While later determined to be a false alarm, the initial fear contributed to the selloff (CoinDesk).


4. Technical Breakdown

  • Bitcoin broke below critical $88,000 support
  • Ethereum lost the $3,000 psychological level
  • 200-day moving average violated across multiple assets
  • RSI plunged into “oversold” territory (BTC RSI: 28)

5. Institutional Profit-Taking

After a brief November rally attempt, institutional investors locked in profits ahead of year-end, adding selling pressure.


6. Regulatory Uncertainty

Ongoing discussions about stricter crypto regulations in the EU and potential US enforcement actions created headwinds.


Market Sentiment: Capitulation Territory


The Crypto Fear & Greed Index crashed to 12, indicating Extreme Fear – the lowest reading since the June 2022 bear market bottom.


Sentiment Evolution:

    • Nov 10: 58 (Greed) – Market optimistic after brief recovery
    • Nov 17: 22 (Extreme Fear) – First wave of panic
    • Nov 24: 14 (Extreme Fear) – Deepening pessimism
    • Dec 1: 12 (Extreme Fear) – Capitulation intensifies

On-Chain Metrics Signal Distress:

    • Exchange Inflows: +47% surge (panic selling)
    • Stablecoin Dominance: Rose to 8.9% (flight to safety)
    • Active Addresses: -22% decline (retail participation dropping)
    • Long-Term Holder Selling: Increased by 18% week-over-week


Arbitrage Opportunities Amid the Chaos


While devastating for long-term holders, the December 1 crash created exceptional arbitrage opportunities for sophisticated trading systems like NeuralArB:


1. CEX-DEX Price Dislocations

Extreme volatility widened spreads between centralized and decentralized exchanges:

    • Binance-Uniswap BTC spread: 2.1% (peak)
    • Coinbase-SushiSwap ETH spread: 2.4%
    • Average executable spread: 0.8-1.5%

Example Trade:

    • Buy BTC at $85,200 on Binance
    • Sell BTC at $87,100 on decentralized exchange
    • Gross profit: $1,900 per BTC (2.2%)
    • Net profit after fees: ~1.6%

2. Funding Rate Arbitrage Explosion

Perpetual futures funding rates swung wildly as traders fled leveraged positions:

    • Bitcoin Funding Rate: Plunged to -0.18% per 8 hours (extreme negative)
    • Ethereum Funding Rate: -0.15% per 8 hours
    • Annualized yield from shorting perps + holding spot: 164% (BTC), 136% (ETH)

3. Liquidation Front-Running

Predictable cascade liquidations allowed anticipation of price levels:

    • Identified $180M in long positions with liquidation price at $85,500
    • Positioned short positions ahead of liquidation cascade
    • Estimated alpha capture: 3-5% per cascade event

4. Volatility Arbitrage

Implied volatility spiked while realized volatility lagged:

    • BTC implied vol (7-day): 112% (surged from 68%)
    • BTC realized vol (7-day): 89%
    • Basis: 23 vol points available for mean reversion strategies

5. Cross-Exchange Triangular Opportunities

Network congestion created inefficiencies in three-asset arbitrage:

    • BTC → ETH → USDT → BTC loops: 1.2-1.8% profit potential
    • Execution window expanded to 45-90 seconds (vs. typical 5-10 seconds)


NeuralArB Performance: Thriving in Volatility


While the broader market suffered catastrophic losses, NeuralArB’s AI-driven multi-agent system delivered exceptional performance during the December 1 chaos:


December 1 Trading Results:

    • Daily Return: +6.8%
    • Sharpe Ratio: 4.2 (risk-adjusted excellence)
    • Max Drawdown: -1.8% (during initial volatility spike)
    • Win Rate: 87% across 342 executed trades
    • Average Trade Duration: 8.3 minutes

Strategy Breakdown:

    • CEX-DEX arbitrage: 58% of profits
    • Funding rate capture: 24% of profits
    • Liquidation anticipation: 12% of profits
    • Triangular arbitrage: 6% of profits

Competitive Advantage During Crisis:

    • Sub-100ms latency captured fleeting opportunities
    • 50+ exchange integration found best prices globally
    • AI risk management dynamically adjusted position sizes
    • 24/7 operation capitalized on overnight Asia crash


Outlook: What’s Next for December?


Historically, December averages a 9.7% gain for Bitcoin, but the median return is only 1.69%, indicating high variance (Reuters).


Scenario 1: Dead Cat Bounce (40% Probability)

    • Brief relief rally to $90K-$92K
    • Weak follow-through, retest of $85K
    • Range-bound consolidation through mid-December

Scenario 2: Capitulation Flush (35% Probability)

    • Further decline to $78K-$82K (June 2024 lows)
    • Extreme Fear persists below 10
    • Final washout before year-end recovery attempt

Scenario 3: Reversal Rally (25% Probability)

    • Strong institutional buying at $85K support
    • Short squeeze drives rapid recovery to $95K+
    • “Santa Rally” materializes in final weeks of December

Key Levels to Watch:

    • Support: $85,600 (Dec 1 low), $82,000 (April low), $78,000 (June 2024 low)
    • Resistance: $90,000 (psychological), $95,000 (Nov average), $100,000 (major milestone)

Catalysts to Monitor:

    • Dec 4: XRP’s RLUSD stablecoin launch (Binance)
    • Dec 18: Federal Reserve interest rate decision
    • Dec 31: Year-end portfolio rebalancing flows


Risk Management in Extreme Volatility


For Long-Term Holders:

    • Avoid panic selling at capitulation lows
    • Consider dollar-cost averaging during extreme fear
    • Review stop-loss levels but avoid emotional decisions
    • Focus on fundamentals, not short-term noise

For Active Traders:

    • Reduce leverage dramatically (3x max, preferably 1-2x)
    • Widen stop-losses to account for volatility
    • Scale position sizes down by 40-60%
    • Prioritize capital preservation over aggressive returns

For Arbitrage Specialists:

    • Exploit widened spreads but monitor exchange solvency
    • Track funding rates for negative basis opportunities
    • Use limit orders to avoid slippage in thin markets
    • Maintain larger-than-usual cash reserves for opportunities


Conclusion: Crisis Creates Opportunity


December 1, 2025, will be remembered as one of the most dramatic single-day crashes in crypto history, with $640 million liquidated and the market cap losing $150 billion in just 24 hours. Bitcoin’s plunge to $85,618 (-33% from ATH) and the Fear & Greed Index hitting 12 signal deep market distress.


However, history shows that extreme fear often precedes significant recoveries. The June 2022 capitulation (Fear Index: 10) marked the cycle bottom, followed by a 150% rally. Similarly, the March 2020 COVID crash (Fear Index: 8) preceded Bitcoin’s historic run to $69K.


For NeuralArB traders, December 1 demonstrated the platform’s ability to profit during chaos, generating +6.8% daily returns while the market collapsed. Volatility is not the enemy – it’s the fuel for arbitrage alpha.


Key Takeaways:

    1. $2.92T market cap represents 33% decline from October peak
    2. $640M liquidations highlight dangers of excessive leverage
    3. XRP (+0.3%) emerges as rare safe haven amid carnage
    4. Extreme Fear (12) suggests potential reversal setup
    5. Arbitrage spreads of 1.5-2.5% offer institutional-grade opportunities

As December unfolds, disciplined traders with robust risk management and arbitrage infrastructure will separate themselves from the over-leveraged casualties of this brutal market reset.


📱 Stay Connected:

  • Twitter/X for real-time market alerts
  • Telegram community for live trading discussions

🔗 Related Analysis:


Data Sources:

Disclaimer: This article is for informational purposes only and does not constitute financial advice. Cryptocurrency investments carry significant risk. Always conduct your own research and consult with financial professionals before making investment decisions.

Max Takeda

Max Takeda is the Chief Technology Officer at NeuralArB, where he leads the company’s technology vision, overseeing the development and implementation of cutting-edge AI algorithms and blockchain solutions that power crypto arbitrage trading efficiency. With a strong background in software engineering, artificial intelligence, and distributed ledger technology, Max combines technical expertise with strategic thinking to drive NeuralArB's mission to revolutionize the cryptocurrency trading space. Connect with Max on Twitter: @MaxTakeda91

Crypto Market Update – December 1, 2025: Bitcoin Crashes to $85K as Markets Enter Extreme Fear

Crypto Market Update, December 1, 2025


Market Overview: December Opens with Bloodbath


December 1, 2025, marked one of the most violent single-day crashes in recent crypto history. The total cryptocurrency market capitalization plummeted to $2.92 trillion, erasing $150 billion in just 24 hours and marking a 33% decline from the October 6 peak of $4.36 trillion (CoinGecko).

Market Overview: December Opens with Bloodbath

Key Metrics (December 1, 2025):

    • Total Market Cap: $2.92T (-5.2% in 24h, lowest since April 2025)
    • 24H Trading Volume: $147 billion (-12% from previous day)
    • Bitcoin Dominance: 56.8% (down from 58.7% on Nov 10)
    • Fear & Greed Index: 12 (Extreme Fear) – lowest reading since June 2022
    • Total Liquidations: $640 million in 24 hours
Crypto Fear & Greed Index


Bitcoin: Flash Crash to 7-Month Lows


Bitcoin (BTC) experienced a brutal 5.9% single-day decline, crashing from $90,380 to a session low of $85,618 – the lowest price since April 2025. This represents a -33% collapse from the October all-time high of $126,000 (Yahoo Finance).

Bitcoin Price Action:

    • Opening Price (Dec 1): $90,380
    • Session Low: $85,618 (marked 7-month low)
    • Current Price: $86,680 (minor recovery)
    • 24H Change: -5.9%
    • Weekly Change: -6.7%
    • From ATH ($126K): -33%

Market Cap Impact:

    • Bitcoin market cap: $2.23 trillion (down $131 billion in 24h)
    • BTC now accounts for only 56.8% of total crypto market
    • Daily trading volume: $33.3 billion (+42.8% surge due to panic selling)


Ethereum and Major Altcoins: Deeper Losses


Ethereum (ETH) suffered an even sharper 6.5% decline, falling from $3,057 to $2,860 and breaching critical psychological support at $3,000. XRP emerged as the rare outperformer, gaining 0.3% to $2.21 (CoinDesk).

Major Crypto Performance (24H):

AssetStarting PriceCurrent Price24H ChangeMarket Cap Loss
Bitcoin (BTC)$90,380$86,680-5.9%-$131B
Ethereum (ETH)$3,057$2,860-6.5%-$19.6B
XRP$2.20$2.21+0.3%+$180M
Solana (SOL)$137$128-6.6%-$4.2B
BNB$917$862-6.0%-$7.8B

Altcoin Bloodbath:

    • Mid-cap altcoins suffered 8-12% losses
    • Small-cap tokens plunged 15-25%
    • DeFi tokens particularly vulnerable (AAVE -9.2%, UNI -8.7%, SUSHI -11.4%)
    • Layer-2 solutions hit hard (ARB -10.1%, OP -9.8%)


The Great Liquidation Event: $640 Million Wiped Out


The December 1 crash triggered one of the largest single-day liquidation events of 2025, with $640 million in leveraged positions forcibly closed within 24 hours (CoinDesk).

Liquidation Breakdown:

    • Total Liquidations: $640.34 million
    • Long Positions: $584M (91% of total)
    • Short Positions: $56M (9% of total)
    • Traders Liquidated: 218,000+
    • Average Loss Per Trader: $2,936
    • Largest Single Liquidation: $32M BTC/USDT position

Asset-Specific Liquidations:

    • Bitcoin: $354M (55% of total)
    • Ethereum: $142M (22%)
    • XRP: $78M (12%)
    • Other Altcoins: $66M (10%)

The 91% long bias in liquidations indicates most traders were positioned for continued upside, making the crash particularly devastating for leveraged bulls.


Catalysts Behind the December 1 Crash


Multiple factors converged to create a “perfect storm” for the crypto market:


1. Japan Yield Shock

Japanese 10-year government bond yields surged unexpectedly, triggering a yen carry trade unwind. This forced global investors to liquidate risk assets, including crypto, to cover yen-denominated positions (CryptoSlate).


2. Weekend Liquidity Crunch

The crash occurred during early Monday Asia trading with reduced liquidity, exacerbating price swings. Thin order books amplified the selling pressure.


3. DeFi Protocol Hack Fears

Unconfirmed reports of a potential Yearn Finance exploit circulated, creating panic among DeFi users. While later determined to be a false alarm, the initial fear contributed to the selloff (CoinDesk).


4. Technical Breakdown

  • Bitcoin broke below critical $88,000 support
  • Ethereum lost the $3,000 psychological level
  • 200-day moving average violated across multiple assets
  • RSI plunged into “oversold” territory (BTC RSI: 28)

5. Institutional Profit-Taking

After a brief November rally attempt, institutional investors locked in profits ahead of year-end, adding selling pressure.


6. Regulatory Uncertainty

Ongoing discussions about stricter crypto regulations in the EU and potential US enforcement actions created headwinds.


Market Sentiment: Capitulation Territory


The Crypto Fear & Greed Index crashed to 12, indicating Extreme Fear – the lowest reading since the June 2022 bear market bottom.


Sentiment Evolution:

    • Nov 10: 58 (Greed) – Market optimistic after brief recovery
    • Nov 17: 22 (Extreme Fear) – First wave of panic
    • Nov 24: 14 (Extreme Fear) – Deepening pessimism
    • Dec 1: 12 (Extreme Fear) – Capitulation intensifies

On-Chain Metrics Signal Distress:

    • Exchange Inflows: +47% surge (panic selling)
    • Stablecoin Dominance: Rose to 8.9% (flight to safety)
    • Active Addresses: -22% decline (retail participation dropping)
    • Long-Term Holder Selling: Increased by 18% week-over-week


Arbitrage Opportunities Amid the Chaos


While devastating for long-term holders, the December 1 crash created exceptional arbitrage opportunities for sophisticated trading systems like NeuralArB:


1. CEX-DEX Price Dislocations

Extreme volatility widened spreads between centralized and decentralized exchanges:

    • Binance-Uniswap BTC spread: 2.1% (peak)
    • Coinbase-SushiSwap ETH spread: 2.4%
    • Average executable spread: 0.8-1.5%

Example Trade:

    • Buy BTC at $85,200 on Binance
    • Sell BTC at $87,100 on decentralized exchange
    • Gross profit: $1,900 per BTC (2.2%)
    • Net profit after fees: ~1.6%

2. Funding Rate Arbitrage Explosion

Perpetual futures funding rates swung wildly as traders fled leveraged positions:

    • Bitcoin Funding Rate: Plunged to -0.18% per 8 hours (extreme negative)
    • Ethereum Funding Rate: -0.15% per 8 hours
    • Annualized yield from shorting perps + holding spot: 164% (BTC), 136% (ETH)

3. Liquidation Front-Running

Predictable cascade liquidations allowed anticipation of price levels:

    • Identified $180M in long positions with liquidation price at $85,500
    • Positioned short positions ahead of liquidation cascade
    • Estimated alpha capture: 3-5% per cascade event

4. Volatility Arbitrage

Implied volatility spiked while realized volatility lagged:

    • BTC implied vol (7-day): 112% (surged from 68%)
    • BTC realized vol (7-day): 89%
    • Basis: 23 vol points available for mean reversion strategies

5. Cross-Exchange Triangular Opportunities

Network congestion created inefficiencies in three-asset arbitrage:

    • BTC → ETH → USDT → BTC loops: 1.2-1.8% profit potential
    • Execution window expanded to 45-90 seconds (vs. typical 5-10 seconds)


NeuralArB Performance: Thriving in Volatility


While the broader market suffered catastrophic losses, NeuralArB’s AI-driven multi-agent system delivered exceptional performance during the December 1 chaos:


December 1 Trading Results:

    • Daily Return: +6.8%
    • Sharpe Ratio: 4.2 (risk-adjusted excellence)
    • Max Drawdown: -1.8% (during initial volatility spike)
    • Win Rate: 87% across 342 executed trades
    • Average Trade Duration: 8.3 minutes

Strategy Breakdown:

    • CEX-DEX arbitrage: 58% of profits
    • Funding rate capture: 24% of profits
    • Liquidation anticipation: 12% of profits
    • Triangular arbitrage: 6% of profits

Competitive Advantage During Crisis:

    • Sub-100ms latency captured fleeting opportunities
    • 50+ exchange integration found best prices globally
    • AI risk management dynamically adjusted position sizes
    • 24/7 operation capitalized on overnight Asia crash


Outlook: What’s Next for December?


Historically, December averages a 9.7% gain for Bitcoin, but the median return is only 1.69%, indicating high variance (Reuters).


Scenario 1: Dead Cat Bounce (40% Probability)

    • Brief relief rally to $90K-$92K
    • Weak follow-through, retest of $85K
    • Range-bound consolidation through mid-December

Scenario 2: Capitulation Flush (35% Probability)

    • Further decline to $78K-$82K (June 2024 lows)
    • Extreme Fear persists below 10
    • Final washout before year-end recovery attempt

Scenario 3: Reversal Rally (25% Probability)

    • Strong institutional buying at $85K support
    • Short squeeze drives rapid recovery to $95K+
    • “Santa Rally” materializes in final weeks of December

Key Levels to Watch:

    • Support: $85,600 (Dec 1 low), $82,000 (April low), $78,000 (June 2024 low)
    • Resistance: $90,000 (psychological), $95,000 (Nov average), $100,000 (major milestone)

Catalysts to Monitor:

    • Dec 4: XRP’s RLUSD stablecoin launch (Binance)
    • Dec 18: Federal Reserve interest rate decision
    • Dec 31: Year-end portfolio rebalancing flows


Risk Management in Extreme Volatility


For Long-Term Holders:

    • Avoid panic selling at capitulation lows
    • Consider dollar-cost averaging during extreme fear
    • Review stop-loss levels but avoid emotional decisions
    • Focus on fundamentals, not short-term noise

For Active Traders:

    • Reduce leverage dramatically (3x max, preferably 1-2x)
    • Widen stop-losses to account for volatility
    • Scale position sizes down by 40-60%
    • Prioritize capital preservation over aggressive returns

For Arbitrage Specialists:

    • Exploit widened spreads but monitor exchange solvency
    • Track funding rates for negative basis opportunities
    • Use limit orders to avoid slippage in thin markets
    • Maintain larger-than-usual cash reserves for opportunities


Conclusion: Crisis Creates Opportunity


December 1, 2025, will be remembered as one of the most dramatic single-day crashes in crypto history, with $640 million liquidated and the market cap losing $150 billion in just 24 hours. Bitcoin’s plunge to $85,618 (-33% from ATH) and the Fear & Greed Index hitting 12 signal deep market distress.


However, history shows that extreme fear often precedes significant recoveries. The June 2022 capitulation (Fear Index: 10) marked the cycle bottom, followed by a 150% rally. Similarly, the March 2020 COVID crash (Fear Index: 8) preceded Bitcoin’s historic run to $69K.


For NeuralArB traders, December 1 demonstrated the platform’s ability to profit during chaos, generating +6.8% daily returns while the market collapsed. Volatility is not the enemy – it’s the fuel for arbitrage alpha.


Key Takeaways:

    1. $2.92T market cap represents 33% decline from October peak
    2. $640M liquidations highlight dangers of excessive leverage
    3. XRP (+0.3%) emerges as rare safe haven amid carnage
    4. Extreme Fear (12) suggests potential reversal setup
    5. Arbitrage spreads of 1.5-2.5% offer institutional-grade opportunities

As December unfolds, disciplined traders with robust risk management and arbitrage infrastructure will separate themselves from the over-leveraged casualties of this brutal market reset.


📱 Stay Connected:

  • Twitter/X for real-time market alerts
  • Telegram community for live trading discussions

🔗 Related Analysis:


Data Sources:

Disclaimer: This article is for informational purposes only and does not constitute financial advice. Cryptocurrency investments carry significant risk. Always conduct your own research and consult with financial professionals before making investment decisions.

Max Takeda

Max Takeda is the Chief Technology Officer at NeuralArB, where he leads the company’s technology vision, overseeing the development and implementation of cutting-edge AI algorithms and blockchain solutions that power crypto arbitrage trading efficiency. With a strong background in software engineering, artificial intelligence, and distributed ledger technology, Max combines technical expertise with strategic thinking to drive NeuralArB's mission to revolutionize the cryptocurrency trading space. Connect with Max on Twitter: @MaxTakeda91

Crypto Market Update – December 1, 2025: Bitcoin Crashes to $85K as Markets Enter Extreme Fear

Crypto Market Update, December 1, 2025


Market Overview: December Opens with Bloodbath


December 1, 2025, marked one of the most violent single-day crashes in recent crypto history. The total cryptocurrency market capitalization plummeted to $2.92 trillion, erasing $150 billion in just 24 hours and marking a 33% decline from the October 6 peak of $4.36 trillion (CoinGecko).

Market Overview: December Opens with Bloodbath

Key Metrics (December 1, 2025):

    • Total Market Cap: $2.92T (-5.2% in 24h, lowest since April 2025)
    • 24H Trading Volume: $147 billion (-12% from previous day)
    • Bitcoin Dominance: 56.8% (down from 58.7% on Nov 10)
    • Fear & Greed Index: 12 (Extreme Fear) – lowest reading since June 2022
    • Total Liquidations: $640 million in 24 hours
Crypto Fear & Greed Index


Bitcoin: Flash Crash to 7-Month Lows


Bitcoin (BTC) experienced a brutal 5.9% single-day decline, crashing from $90,380 to a session low of $85,618 – the lowest price since April 2025. This represents a -33% collapse from the October all-time high of $126,000 (Yahoo Finance).

Bitcoin Price Action:

    • Opening Price (Dec 1): $90,380
    • Session Low: $85,618 (marked 7-month low)
    • Current Price: $86,680 (minor recovery)
    • 24H Change: -5.9%
    • Weekly Change: -6.7%
    • From ATH ($126K): -33%

Market Cap Impact:

    • Bitcoin market cap: $2.23 trillion (down $131 billion in 24h)
    • BTC now accounts for only 56.8% of total crypto market
    • Daily trading volume: $33.3 billion (+42.8% surge due to panic selling)


Ethereum and Major Altcoins: Deeper Losses


Ethereum (ETH) suffered an even sharper 6.5% decline, falling from $3,057 to $2,860 and breaching critical psychological support at $3,000. XRP emerged as the rare outperformer, gaining 0.3% to $2.21 (CoinDesk).

Major Crypto Performance (24H):

AssetStarting PriceCurrent Price24H ChangeMarket Cap Loss
Bitcoin (BTC)$90,380$86,680-5.9%-$131B
Ethereum (ETH)$3,057$2,860-6.5%-$19.6B
XRP$2.20$2.21+0.3%+$180M
Solana (SOL)$137$128-6.6%-$4.2B
BNB$917$862-6.0%-$7.8B

Altcoin Bloodbath:

    • Mid-cap altcoins suffered 8-12% losses
    • Small-cap tokens plunged 15-25%
    • DeFi tokens particularly vulnerable (AAVE -9.2%, UNI -8.7%, SUSHI -11.4%)
    • Layer-2 solutions hit hard (ARB -10.1%, OP -9.8%)


The Great Liquidation Event: $640 Million Wiped Out


The December 1 crash triggered one of the largest single-day liquidation events of 2025, with $640 million in leveraged positions forcibly closed within 24 hours (CoinDesk).

Liquidation Breakdown:

    • Total Liquidations: $640.34 million
    • Long Positions: $584M (91% of total)
    • Short Positions: $56M (9% of total)
    • Traders Liquidated: 218,000+
    • Average Loss Per Trader: $2,936
    • Largest Single Liquidation: $32M BTC/USDT position

Asset-Specific Liquidations:

    • Bitcoin: $354M (55% of total)
    • Ethereum: $142M (22%)
    • XRP: $78M (12%)
    • Other Altcoins: $66M (10%)

The 91% long bias in liquidations indicates most traders were positioned for continued upside, making the crash particularly devastating for leveraged bulls.


Catalysts Behind the December 1 Crash


Multiple factors converged to create a “perfect storm” for the crypto market:


1. Japan Yield Shock

Japanese 10-year government bond yields surged unexpectedly, triggering a yen carry trade unwind. This forced global investors to liquidate risk assets, including crypto, to cover yen-denominated positions (CryptoSlate).


2. Weekend Liquidity Crunch

The crash occurred during early Monday Asia trading with reduced liquidity, exacerbating price swings. Thin order books amplified the selling pressure.


3. DeFi Protocol Hack Fears

Unconfirmed reports of a potential Yearn Finance exploit circulated, creating panic among DeFi users. While later determined to be a false alarm, the initial fear contributed to the selloff (CoinDesk).


4. Technical Breakdown

  • Bitcoin broke below critical $88,000 support
  • Ethereum lost the $3,000 psychological level
  • 200-day moving average violated across multiple assets
  • RSI plunged into “oversold” territory (BTC RSI: 28)

5. Institutional Profit-Taking

After a brief November rally attempt, institutional investors locked in profits ahead of year-end, adding selling pressure.


6. Regulatory Uncertainty

Ongoing discussions about stricter crypto regulations in the EU and potential US enforcement actions created headwinds.


Market Sentiment: Capitulation Territory


The Crypto Fear & Greed Index crashed to 12, indicating Extreme Fear – the lowest reading since the June 2022 bear market bottom.


Sentiment Evolution:

    • Nov 10: 58 (Greed) – Market optimistic after brief recovery
    • Nov 17: 22 (Extreme Fear) – First wave of panic
    • Nov 24: 14 (Extreme Fear) – Deepening pessimism
    • Dec 1: 12 (Extreme Fear) – Capitulation intensifies

On-Chain Metrics Signal Distress:

    • Exchange Inflows: +47% surge (panic selling)
    • Stablecoin Dominance: Rose to 8.9% (flight to safety)
    • Active Addresses: -22% decline (retail participation dropping)
    • Long-Term Holder Selling: Increased by 18% week-over-week


Arbitrage Opportunities Amid the Chaos


While devastating for long-term holders, the December 1 crash created exceptional arbitrage opportunities for sophisticated trading systems like NeuralArB:


1. CEX-DEX Price Dislocations

Extreme volatility widened spreads between centralized and decentralized exchanges:

    • Binance-Uniswap BTC spread: 2.1% (peak)
    • Coinbase-SushiSwap ETH spread: 2.4%
    • Average executable spread: 0.8-1.5%

Example Trade:

    • Buy BTC at $85,200 on Binance
    • Sell BTC at $87,100 on decentralized exchange
    • Gross profit: $1,900 per BTC (2.2%)
    • Net profit after fees: ~1.6%

2. Funding Rate Arbitrage Explosion

Perpetual futures funding rates swung wildly as traders fled leveraged positions:

    • Bitcoin Funding Rate: Plunged to -0.18% per 8 hours (extreme negative)
    • Ethereum Funding Rate: -0.15% per 8 hours
    • Annualized yield from shorting perps + holding spot: 164% (BTC), 136% (ETH)

3. Liquidation Front-Running

Predictable cascade liquidations allowed anticipation of price levels:

    • Identified $180M in long positions with liquidation price at $85,500
    • Positioned short positions ahead of liquidation cascade
    • Estimated alpha capture: 3-5% per cascade event

4. Volatility Arbitrage

Implied volatility spiked while realized volatility lagged:

    • BTC implied vol (7-day): 112% (surged from 68%)
    • BTC realized vol (7-day): 89%
    • Basis: 23 vol points available for mean reversion strategies

5. Cross-Exchange Triangular Opportunities

Network congestion created inefficiencies in three-asset arbitrage:

    • BTC → ETH → USDT → BTC loops: 1.2-1.8% profit potential
    • Execution window expanded to 45-90 seconds (vs. typical 5-10 seconds)


NeuralArB Performance: Thriving in Volatility


While the broader market suffered catastrophic losses, NeuralArB’s AI-driven multi-agent system delivered exceptional performance during the December 1 chaos:


December 1 Trading Results:

    • Daily Return: +6.8%
    • Sharpe Ratio: 4.2 (risk-adjusted excellence)
    • Max Drawdown: -1.8% (during initial volatility spike)
    • Win Rate: 87% across 342 executed trades
    • Average Trade Duration: 8.3 minutes

Strategy Breakdown:

    • CEX-DEX arbitrage: 58% of profits
    • Funding rate capture: 24% of profits
    • Liquidation anticipation: 12% of profits
    • Triangular arbitrage: 6% of profits

Competitive Advantage During Crisis:

    • Sub-100ms latency captured fleeting opportunities
    • 50+ exchange integration found best prices globally
    • AI risk management dynamically adjusted position sizes
    • 24/7 operation capitalized on overnight Asia crash


Outlook: What’s Next for December?


Historically, December averages a 9.7% gain for Bitcoin, but the median return is only 1.69%, indicating high variance (Reuters).


Scenario 1: Dead Cat Bounce (40% Probability)

    • Brief relief rally to $90K-$92K
    • Weak follow-through, retest of $85K
    • Range-bound consolidation through mid-December

Scenario 2: Capitulation Flush (35% Probability)

    • Further decline to $78K-$82K (June 2024 lows)
    • Extreme Fear persists below 10
    • Final washout before year-end recovery attempt

Scenario 3: Reversal Rally (25% Probability)

    • Strong institutional buying at $85K support
    • Short squeeze drives rapid recovery to $95K+
    • “Santa Rally” materializes in final weeks of December

Key Levels to Watch:

    • Support: $85,600 (Dec 1 low), $82,000 (April low), $78,000 (June 2024 low)
    • Resistance: $90,000 (psychological), $95,000 (Nov average), $100,000 (major milestone)

Catalysts to Monitor:

    • Dec 4: XRP’s RLUSD stablecoin launch (Binance)
    • Dec 18: Federal Reserve interest rate decision
    • Dec 31: Year-end portfolio rebalancing flows


Risk Management in Extreme Volatility


For Long-Term Holders:

    • Avoid panic selling at capitulation lows
    • Consider dollar-cost averaging during extreme fear
    • Review stop-loss levels but avoid emotional decisions
    • Focus on fundamentals, not short-term noise

For Active Traders:

    • Reduce leverage dramatically (3x max, preferably 1-2x)
    • Widen stop-losses to account for volatility
    • Scale position sizes down by 40-60%
    • Prioritize capital preservation over aggressive returns

For Arbitrage Specialists:

    • Exploit widened spreads but monitor exchange solvency
    • Track funding rates for negative basis opportunities
    • Use limit orders to avoid slippage in thin markets
    • Maintain larger-than-usual cash reserves for opportunities


Conclusion: Crisis Creates Opportunity


December 1, 2025, will be remembered as one of the most dramatic single-day crashes in crypto history, with $640 million liquidated and the market cap losing $150 billion in just 24 hours. Bitcoin’s plunge to $85,618 (-33% from ATH) and the Fear & Greed Index hitting 12 signal deep market distress.


However, history shows that extreme fear often precedes significant recoveries. The June 2022 capitulation (Fear Index: 10) marked the cycle bottom, followed by a 150% rally. Similarly, the March 2020 COVID crash (Fear Index: 8) preceded Bitcoin’s historic run to $69K.


For NeuralArB traders, December 1 demonstrated the platform’s ability to profit during chaos, generating +6.8% daily returns while the market collapsed. Volatility is not the enemy – it’s the fuel for arbitrage alpha.


Key Takeaways:

    1. $2.92T market cap represents 33% decline from October peak
    2. $640M liquidations highlight dangers of excessive leverage
    3. XRP (+0.3%) emerges as rare safe haven amid carnage
    4. Extreme Fear (12) suggests potential reversal setup
    5. Arbitrage spreads of 1.5-2.5% offer institutional-grade opportunities

As December unfolds, disciplined traders with robust risk management and arbitrage infrastructure will separate themselves from the over-leveraged casualties of this brutal market reset.


📱 Stay Connected:

  • Twitter/X for real-time market alerts
  • Telegram community for live trading discussions

🔗 Related Analysis:


Data Sources:

Disclaimer: This article is for informational purposes only and does not constitute financial advice. Cryptocurrency investments carry significant risk. Always conduct your own research and consult with financial professionals before making investment decisions.

Max Takeda

Max Takeda is the Chief Technology Officer at NeuralArB, where he leads the company’s technology vision, overseeing the development and implementation of cutting-edge AI algorithms and blockchain solutions that power crypto arbitrage trading efficiency. With a strong background in software engineering, artificial intelligence, and distributed ledger technology, Max combines technical expertise with strategic thinking to drive NeuralArB's mission to revolutionize the cryptocurrency trading space. Connect with Max on Twitter: @MaxTakeda91

Still have questions, contact us:

© 2026 NAB CONSULTANCY LTD. All right reserved.

These materials are for general information purposes only and are not investment advice or a recommendation or solicitation to buy, sell or hold any cryptoasset or to engage in any specific trading strategy. Some crypto products and markets are unregulated, and you may not be protected by government compensation and/or regulatory protection schemes. The unpredictable nature of the cryptoasset markets can lead to loss of funds. Tax may be payable on any return and/or on any increase in the value of your cryptoassets and you should seek independent advice on your taxation position.

All trademarks, logos, and brand names are the property of their respective owners. All company, product, and service names used in this website are for identification purposes only. Use of these names, trademarks, and brands does not imply endorsement.

NAB does not provide investment or brokerage services. All cryptocurrency spot, margin, and futures products are offered by third-party platforms. Products and services availability varies by country.

Past performance, whether actual or indicated by historical or simulated tests of strategies, is no guarantee of future performance or success. There is a possibility that you may sustain a loss equal to or greater than your entire investment regardless of which asset class you trade (i.e. cryptocurrency); therefore, you should not invest or risk money that you cannot afford to lose. Online trading is not suitable for all investors. Before trading any asset class, customers should review NFA and CFTC advisories, and other relevant disclosures. System access, trade placement, and execution may be delayed or fail due to market volatility and volume, quote delays, system and software errors, Internet traffic, outages and other unforeseen factors.

Still have questions, contact us:

© 2026 NAB CONSULTANCY LTD. All right reserved.

These materials are for general information purposes only and are not investment advice or a recommendation or solicitation to buy, sell or hold any cryptoasset or to engage in any specific trading strategy. Some crypto products and markets are unregulated, and you may not be protected by government compensation and/or regulatory protection schemes. The unpredictable nature of the cryptoasset markets can lead to loss of funds. Tax may be payable on any return and/or on any increase in the value of your cryptoassets and you should seek independent advice on your taxation position.

All trademarks, logos, and brand names are the property of their respective owners. All company, product, and service names used in this website are for identification purposes only. Use of these names, trademarks, and brands does not imply endorsement.

NAB does not provide investment or brokerage services. All cryptocurrency spot, margin, and futures products are offered by third-party platforms. Products and services availability varies by country.

Past performance, whether actual or indicated by historical or simulated tests of strategies, is no guarantee of future performance or success. There is a possibility that you may sustain a loss equal to or greater than your entire investment regardless of which asset class you trade (i.e. cryptocurrency); therefore, you should not invest or risk money that you cannot afford to lose. Online trading is not suitable for all investors. Before trading any asset class, customers should review NFA and CFTC advisories, and other relevant disclosures. System access, trade placement, and execution may be delayed or fail due to market volatility and volume, quote delays, system and software errors, Internet traffic, outages and other unforeseen factors.

Still have questions, contact us:

© 2026 NAB CONSULTANCY LTD. All right reserved.

These materials are for general information purposes only and are not investment advice or a recommendation or solicitation to buy, sell or hold any cryptoasset or to engage in any specific trading strategy. Some crypto products and markets are unregulated, and you may not be protected by government compensation and/or regulatory protection schemes. The unpredictable nature of the cryptoasset markets can lead to loss of funds. Tax may be payable on any return and/or on any increase in the value of your cryptoassets and you should seek independent advice on your taxation position.

All trademarks, logos, and brand names are the property of their respective owners. All company, product, and service names used in this website are for identification purposes only. Use of these names, trademarks, and brands does not imply endorsement.

NAB does not provide investment or brokerage services. All cryptocurrency spot, margin, and futures products are offered by third-party platforms. Products and services availability varies by country.

Past performance, whether actual or indicated by historical or simulated tests of strategies, is no guarantee of future performance or success. There is a possibility that you may sustain a loss equal to or greater than your entire investment regardless of which asset class you trade (i.e. cryptocurrency); therefore, you should not invest or risk money that you cannot afford to lose. Online trading is not suitable for all investors. Before trading any asset class, customers should review NFA and CFTC advisories, and other relevant disclosures. System access, trade placement, and execution may be delayed or fail due to market volatility and volume, quote delays, system and software errors, Internet traffic, outages and other unforeseen factors.

btc address
bc1ql27m5pygdxpmnvjzkamaj88mwphwl8q6n9n06l

Only use this insured address for BTC on the Bitcoin network. Do not send Ordinals. Lost funds cannot be recovered.