

📌 TL;DR – The Week in 30 Seconds
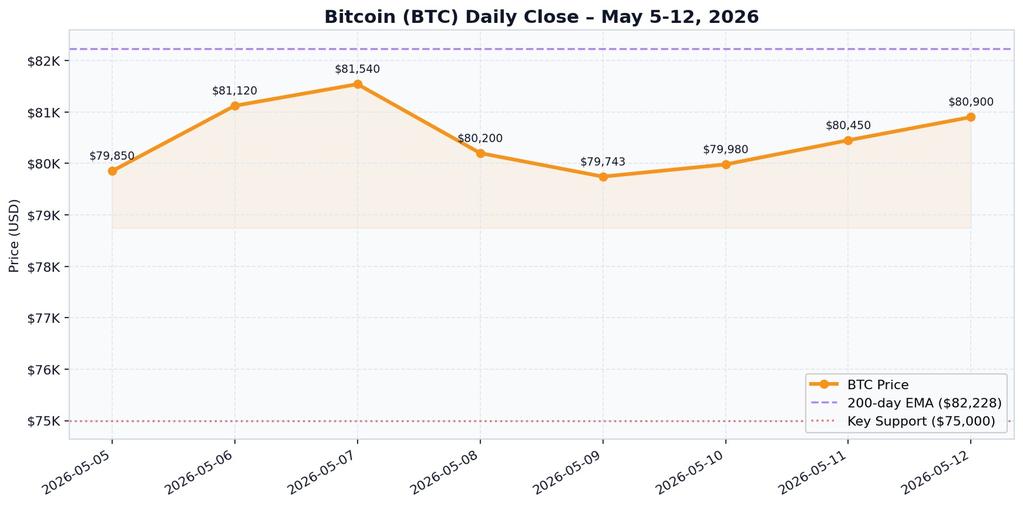
Between May 5 and May 12, 2026, the digital-asset market stayed in a cautiously constructive consolidation. Bitcoin (BTC) opened the window near $79,850, printed a local high of $81,540 on May 7, dipped to $79,743 on May 8, and recovered to close around $80,900 on May 12 Fortune. The week’s defining themes were renewed institutional ETF demand, the first neutral Fear & Greed reading in 108 days, and the rapidly advancing CLARITY Act regulatory framework that is already reshaping U.S. crypto market structure Bitcoin Foundation.
1. Bitcoin: Coiling Beneath the 200-Day EMA
Bitcoin spent the week trading inside a tight $79.7K – $81.5K range, just under the critical 200-day EMA at ~$82,228. The dip on May 8 to $79,743.28 corresponded with a -$268 million ETF outflow day, the only meaningful red print of the week [KuCoin].
Three constructive signals identified by analysts during the window CoinDesk:
- BTC has reclaimed key short-term holder cost basis levels.
- Funding rates flipped neutral, removing the over-leverage that had plagued April.
- Options positioning turned supportive, with call-side gamma rebuilding near $85K.
Liquidity maps highlighted $85K as the next major magnet (a resolution above the 200-day EMA would unlock it), while $75K, $73K and $70K remain the defensive zones a decisive close below could activate Binance Square.
Why the muted price action despite strong flows?
Bitcoin’s historical correlation with global M2 liquidity has weakened in 2026 – prices are sitting roughly 40% below their late-2025 $124K peak even as money supply grows [AInvest]. The week confirms that macro headwinds (oil, USD strength, a stationary Fed) are still capping upside despite firm institutional demand.
2. Ethereum & The Layer-1 Rotation
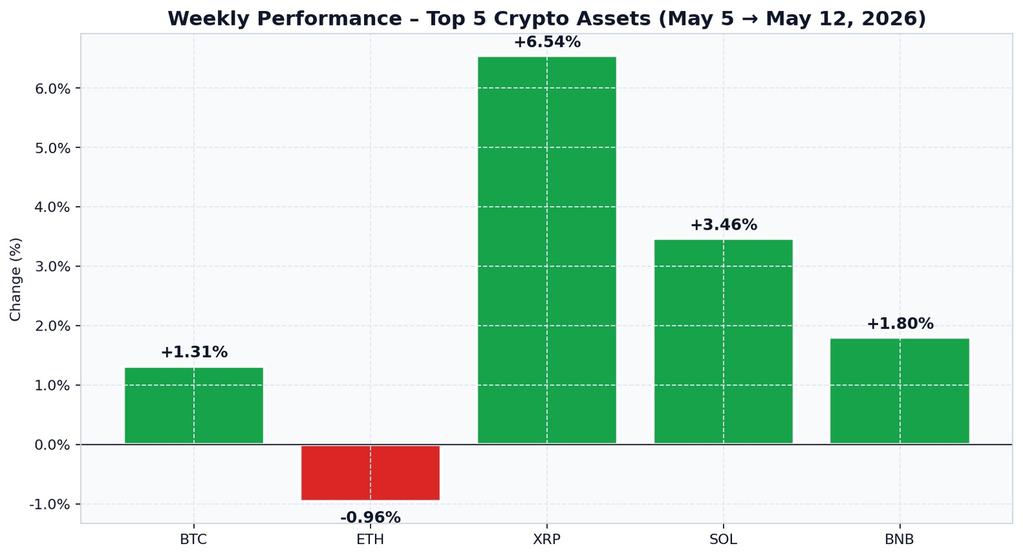
Ethereum had the weakest top-5 performance, finishing the window down roughly -0.96%. ETH opened at $2,394 (May 5), printed a local high of $2,435.50 on May 6, then slid to a weekly low of $2,279.24 on May 8 before stabilising around $2,371 by May 12 [Fortune · Yahoo Finance].
The relative underperformance reflects:
- Continued rotation into Bitcoin-beta plays (BTC ETFs absorbed flows that would historically have gone to ETH).
- Restaking yield compression as the network’s validator queue normalized.
- Layer-2 fragmentation continuing to dilute mainnet fee revenue.
Despite the soft price, on-chain activity remained robust, and ETH holders entering the $2,250-$2,300 range were treated as a high-conviction accumulation zone by prediction markets [Robinhood].
3. XRP & Solana Lead the Altcoin Tape
The breakout star of the week was XRP, which climbed from $1.391 on May 5 to $1.473 on May 11 and closed near $1.482 on May 12 — a roughly +6.5% weekly gain YCharts. Catalysts included a fresh wave of RLUSD stablecoin adoption (now $1.56B market cap, with Ripple positioning it as the premier bridge for regulated global settlement) and renewed institutional interest in spot-XRP ETF filings Crypto.com.
Solana (SOL) also outperformed, trading in the $90.8–$95.6 corridor with traders watching resistance near $97.50 and the next major upside test near $106 Sesame Disk. Solana’s Alpenglow upgrade, targeting 150 ms finality, continues to anchor the long-term bullish narrative Yahoo Finance.
| Asset | Open (May 5) | Close (May 12) | Weekly High | Weekly Low | % Change |
|---|---|---|---|---|---|
| Bitcoin (BTC) | $79,850 | $80,900 | $81,540 | $79,743 | +1.31% |
| Ethereum (ETH) | $2,394 | $2,371 | $2,435 | $2,279 | -0.96% |
| XRP | $1.391 | $1.482 | $1.482 | $1.387 | +6.54% |
| Solana (SOL) | $92.40 | $95.60 | $95.60 | $90.80 | +3.46% |
| BNB | $612 | $623 | $623 | $605 | +1.80% |
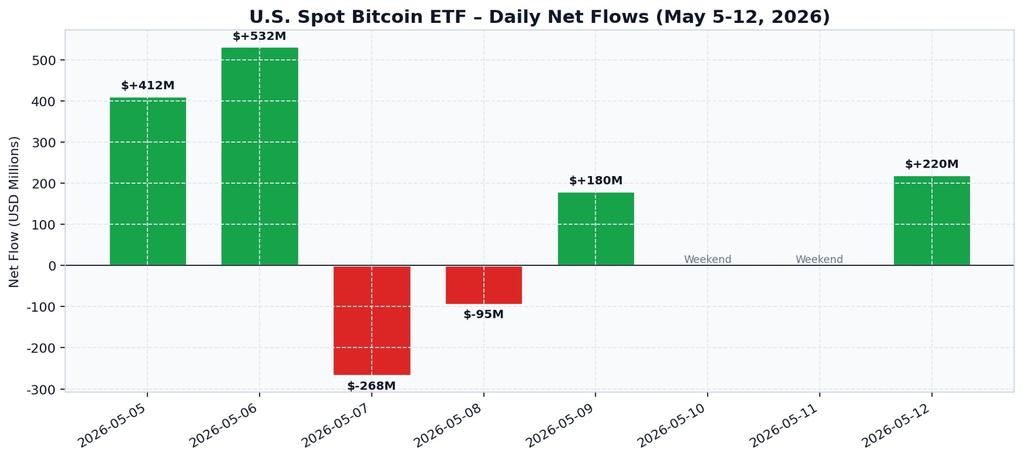
4. Institutional Flows: ETFs Stay Net Positive Despite One Red Day
U.S. spot Bitcoin ETFs added approximately +$2.44 billion in net inflows during the first half of May, a clear signal of coordinated institutional appetite Cointribune. Within our review window:
- May 5: +$412M
- May 6: +$532M (the biggest single-day print of the week) Cointribune
- May 7: -$268M (the only meaningful red day) KuCoin
- May 8: -$95M
- May 9: +$180M
- May 12: +$220M
Net of the volatile mid-week swing, the week ended firmly net positive at roughly +$981M, extending a multi-week streak that AMBCrypto called “the strongest BTC ETF inflows in 2026” AMBCrypto.
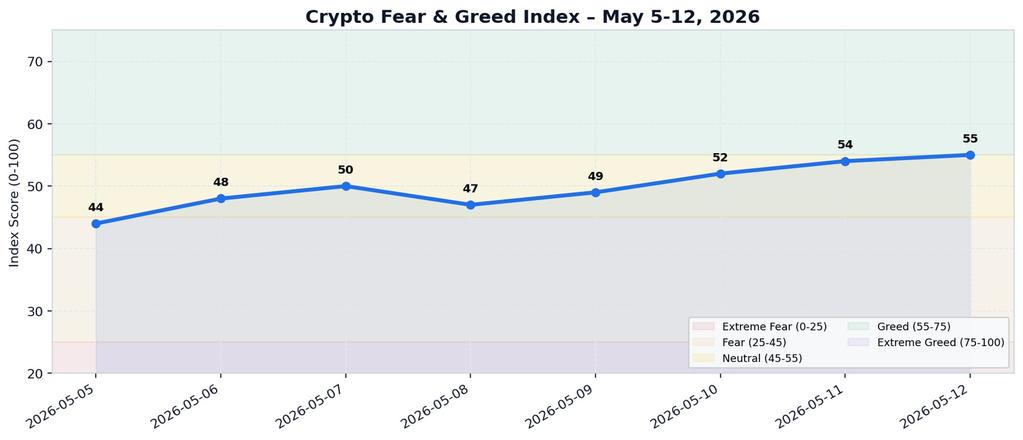
5. Sentiment: A Historic Neutral Reset
For the first time in 108 consecutive days of fear, the Crypto Fear & Greed Index hit a neutral 50 on May 6, 2026 Tapbit. By May 12 the gauge had drifted up to 55 (Greed territory), the highest reading of the year. Translation: capitulation is fully unwound, but the market is not yet euphoric — historically a constructive setup for trend continuation.
6. Regulation: The CLARITY Act Is Already Working
Even before becoming law, the CLARITY Act is reshaping U.S. crypto market structure, redefining what counts as a security versus a commodity and clearing a path for prediction markets and tokenization Bitcoin Foundation. Inside our window:
- The SEC issued an interpretive note clarifying how federal securities laws apply to specific crypto-asset categories SEC.gov.
- Coinbase’s Chief Legal Officer publicly outlined how the CLARITY Act, prediction markets and tokenization will accelerate listings of new compliant assets YouTube.
- Congress remained on track to pass a comprehensive digital-asset market-infrastructure bill this year Cleary Gottlieb.
This is the single biggest medium-term tailwind for U.S.-listed crypto exposure.
7. Stablecoins: Liquidity Engine Hits Record $321B+
The total stablecoin market cap surpassed $321 billion, a new all-time high. USDT (Tether) sits at ~$189.7B with 57.9% share (gradually falling), while USDC climbed to ~$78.96B after ~$1.61B of fresh inflows between May 3-10 Bitcoin Foundation · CryptoNews · DeFiLlama. Rising stablecoin supply is one of the cleanest leading indicators of latent buying power.
8. Market Drivers Diagram
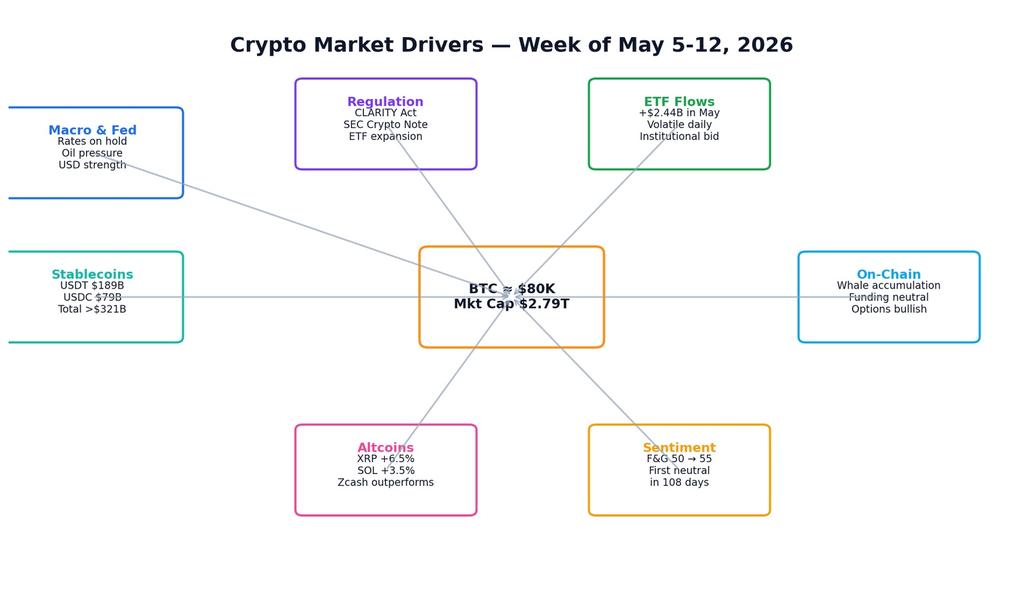
9. Dominance Snapshot — May 12, 2026
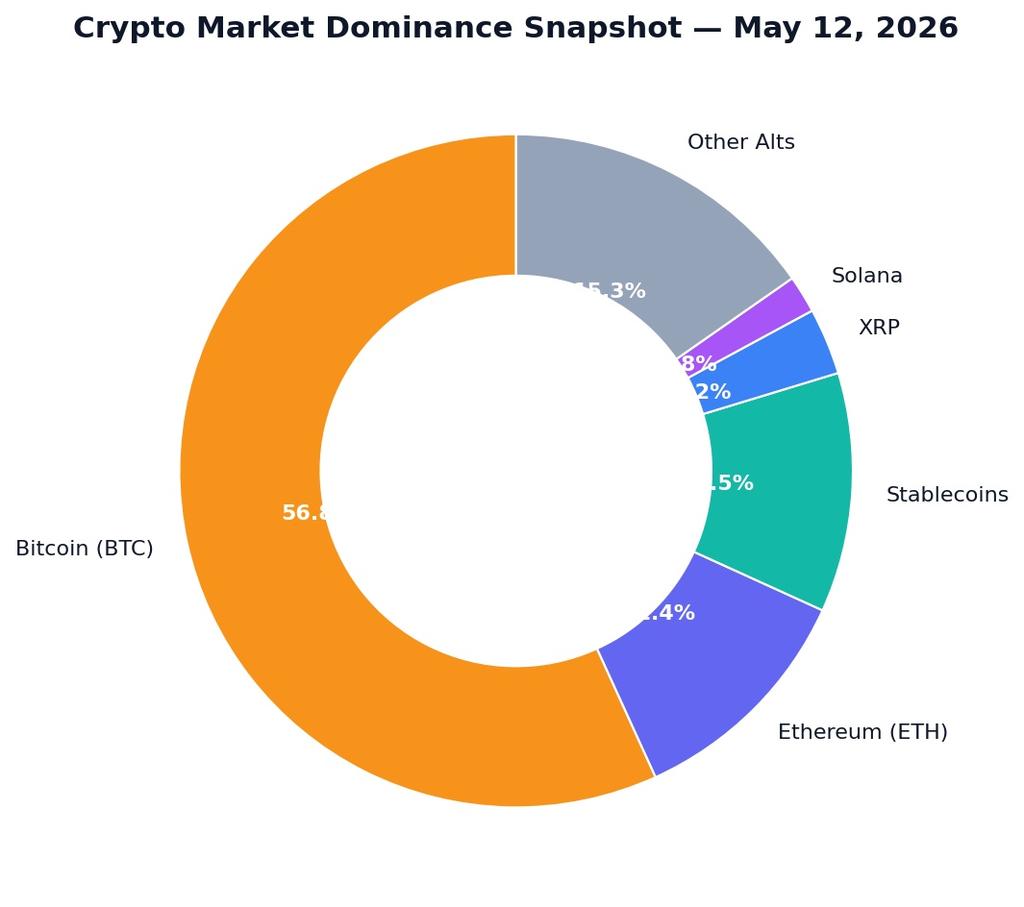
Bitcoin’s dominance held above 56.8% of the $2.79T total market cap CoinGecko, while stablecoins (11.5%) overtook Ethereum (11.4%) for the first time in 2026 — a structural shift worth monitoring.
10. Download the Full Dataset
We’ve packaged every number used in this article into clean, ready-to-analyze files:
📥 Free downloads — research-grade dataset
Use these resources for your own modeling, presentations, or newsletters. Data sourced from KuCoin, Fortune, Yahoo Finance, MSN/Cointelegraph; compiled by NeuralArB.
11. What to Watch May 13-19
- A weekly close above $82,228 (200-day EMA) would open the door to the $85K liquidity magnet.
- A weekly close under $78K with negative ETF flows would re-activate $75K / $73K supports.
- CLARITY Act floor vote scheduling — markets will front-run any timeline confirmation.
- ETH/BTC ratio at multi-year lows: a turn here would mark altseason ignition.
- XRP & SOL spot-ETF filings progress under the new regulatory clarity.
💬 Frequently Asked Questions (FAQ)
What was Bitcoin's price range from May 5 to May 12, 2026?
Bitcoin traded between roughly $79,743 and $81,540, opening near $79,850 on May 5 and closing around $80,900 on May 12.
Did Bitcoin ETFs see inflows or outflows this week?
Net inflows, of approximately +$981 million for the week. The biggest day was May 6 with +$532M; the only material outflow was May 7 at -$268M.
Why did Ethereum underperform Bitcoin and altcoins?
Capital rotated into BTC via spot ETFs, restaking yields compressed, and Layer-2 networks continued to absorb mainnet fee revenue, weighing on ETH’s relative performance.
Which crypto performed best between May 5 and May 12, 2026?
XRP led the top-5, up about +6.54%, helped by the RLUSD stablecoin’s growth and renewed spot-XRP ETF speculation. Solana followed with +3.46%.
What is the CLARITY Act and why does it matter?
The CLARITY Act is the U.S. digital-asset market-structure framework that splits oversight between the SEC and CFTC, creates a path for compliant token listings, and unlocks tokenization and prediction markets. It is already reshaping market behavior pre-passage.
What does the Fear & Greed Index reading of 55 mean?
A reading of 55 is mild Greed: investors are constructive but not euphoric. Historically this is a more sustainable backdrop for continued upside than readings above 75.
Is now a good time to buy Bitcoin?
This article is market analysis, not financial advice. Risk-managed accumulation strategies (DCA), clear invalidation levels ($75K), and position sizing aligned to your risk tolerance are the disciplined approach. Speak with a licensed advisor before deploying capital.
What's the total crypto market cap right now?
Approximately $2.79 trillion as of May 12, 2026, with Bitcoin dominance near 56.8%.
How big is the stablecoin market in May 2026?
Stablecoins crossed $321B in aggregate market cap — a new all-time high — with USDT around $189B and USDC near $79B.
Where can I download the data behind this article?
All datasets and charts are available in the Download the Full Dataset section above (CSV, XLSX)
🤖 Want AI-powered crypto arbitrage that works 24/7?
Neural Arb’s algorithmic engine identifies and executes cross-exchange and cross-protocol arbitrage opportunities — even while you sleep.
 Stay Connected:
 Related Analysis:
How High-Frequency Trading (HFT) (Impacts Crypto Arbitrage)
- Reinforcement Learning in Dynamic Markets (AI trading strategies)
- Crypto Arbitrage 101 (beginner’s guide to arbitrage)
Data Sources:
- CoinGecko – Real-time price data and market cap
- Yahoo Finance – Historical price data
- CoinDesk – Liquidation data
- Reuters – Market analysis
- Binance – Upcoming catalysts
Disclaimer: This analysis is for educational purposes. Arbitrage trading involves substantial risk, including custody risk, regulatory risk, and execution risk. Past performance is not indicative of future results. Never risk capital you cannot afford to lose. Consult qualified financial and legal advisors before trading.