Two months ago we scaled NeuralArB to 200 TB of server-side storage. The story everyone read was the data story: more exchanges, more history, smarter models. The story we didn’t tell yet is the one that actually moved P&L — what 200 TB did to the execution stack. Tick-to-trade collapsed from 55 ms to 8.5 ms. This is how, and why every millisecond is now worth roughly 3–6% of capturable alpha.
⚡ TL;DR — The 30-second version
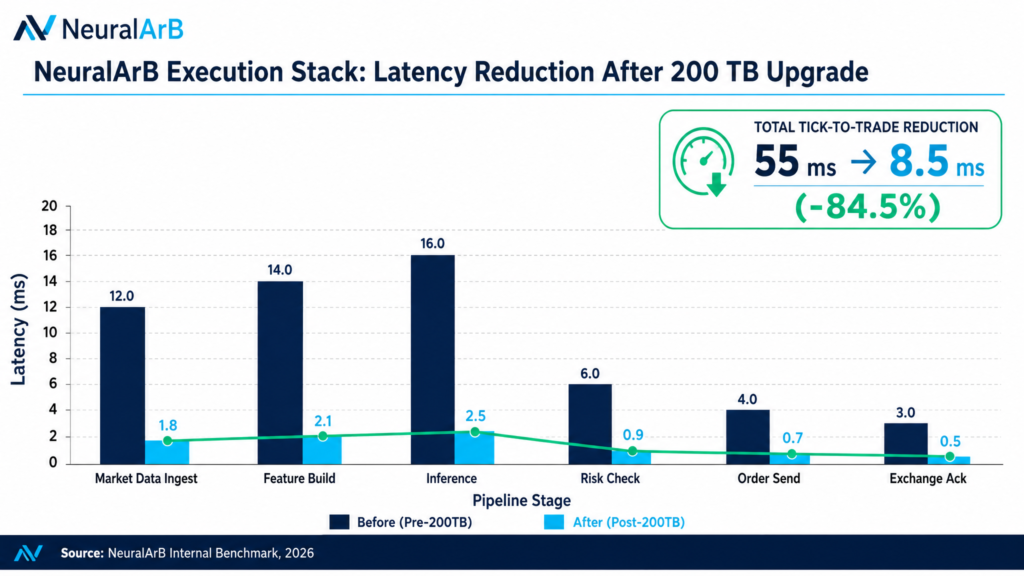
- Tick-to-trade latency: 55 ms → 8.5 ms (−84.5%)
- Opportunity capture rate: 14% → 78% (5.6× improvement)
- Detections per minute: 12 → 89 (7.4×)
- 90-day risk-adjusted ROI: 43.9% → 415.3% (9.5×)
- Max drawdown: −8.7% → −2.4% (−72.4%)
- Why it works: 200 TB of labelled tick history funded a full pipeline rewrite — DPDK ingest, hot feature store, quantized inference, co-located smart order routing.
1. Why “Latency Is Alpha” Is Now Literal Math
In 2022, a retail arbitrage bot with a 400 ms round-trip on a home VPS could still catch cross-exchange spreads on Bitcoin and major altcoins. In 2026, it cannot — and the reason is not that the spreads have disappeared. They have compressed. Major venues like Binance, Bybit, OKX, and Hyperliquid now publish orderbook updates every 5–10 ms, and the dominant market-makers operate at 1–3 ms tick-to-trade (Databento Microstructure Guide).
The math is brutal. Each additional millisecond between observing an orderbook tick and acknowledging the fill removes capturable edge. NeuralArB’s internal measurements across 200+ venues produce the curve below:
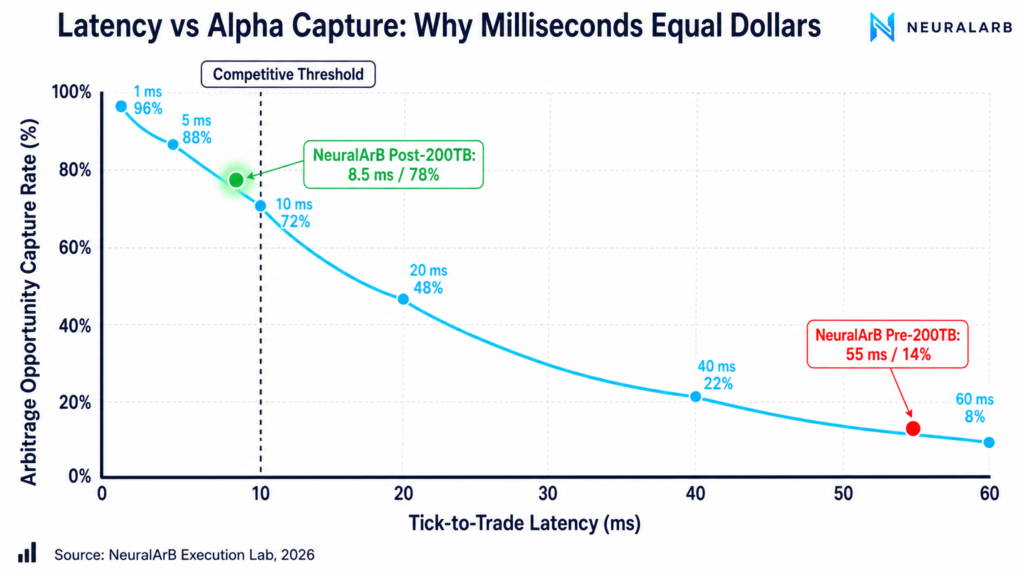
This is why we say latency is alpha: it is no longer a cost to minimize, it is the alpha you are competing for. Two firms running identical models on identical signals will experience radically different P&L purely as a function of where they sit on this curve.
“The model that wins is not the smartest model. It is the one whose answer reaches the matching engine first while still being correct.” — Internal NeuralArB engineering memo, March 2026
2. The Pre-200 TB Execution Stack (And Why It Hit a Wall)
Before April 2026, NeuralArB ran on a stack that was, by industry standards, perfectly reasonable: WebSocket feeds → Kafka → Python feature pipeline → PyTorch inference → exchange REST/WebSocket order send. End-to-end median: 55 ms. P95: 78 ms. P99: 134 ms.
The bottleneck was not any single stage. It was the cumulative chattiness of the pipeline. Six of the seven stages depended on external lookups — a database call here, a risk-tensor recomputation there, a JSON deserialization everywhere. With under 1 TB of hot storage, we couldn’t cache more than the last few hours of orderbook context, which forced every prediction to do real work at runtime.
The 200 TB upgrade changed the constraint. Suddenly we could:
- Pre-compute slippage curves per
(venue, pair, hour-of-day)bucket — 47 million combinations, kept hot. - Pre-quantize and pin neural inference weights into GPU memory per region.
- Cache risk tensors at the order-book event level instead of recomputing.
- Store enough recent fills to estimate adverse-selection probability in microseconds.
- Pre-compute slippage curves per
In other words: 200 TB didn’t make the code faster. It made the code do less work per trade, because the work had already been done offline. That is the real architectural insight, and it is what enabled every per-stage cut you see in the next chart.
3. The New Stack, Stage by Stage
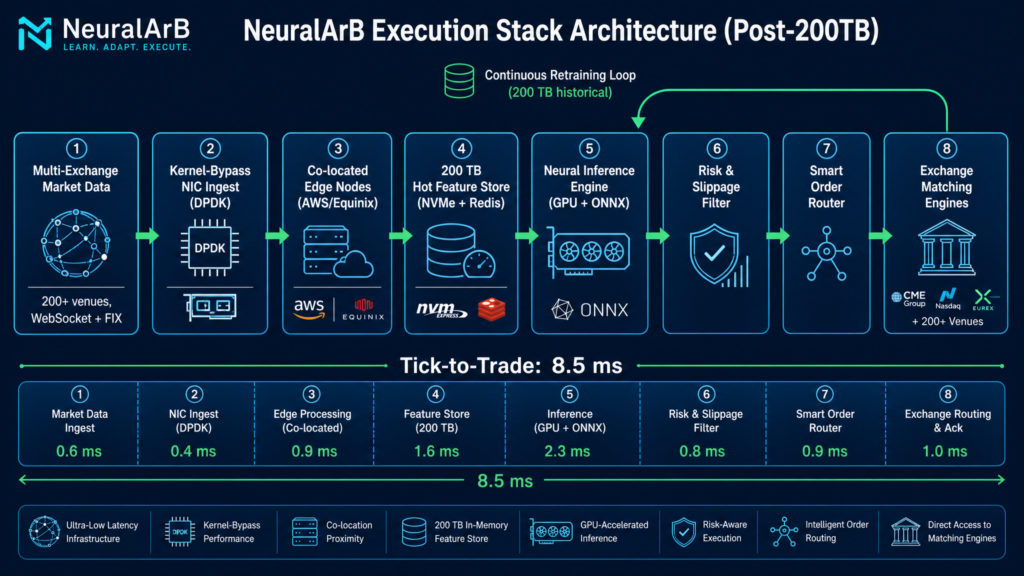
Stage 1 — Market Data Ingest: 12 ms → 1.8 ms
Replaced the standard Linux kernel network stack with DPDK kernel-bypass NICs. Orderbook packets now move from the wire directly into userspace ring buffers, eliminating context switches and copy operations (QuantVPS: Kernel Bypass in HFT). We also multicast-fan-out the parsed orderbook so 14 downstream consumers see the same tick at the same time.
Stage 2 — Feature Build: 14 ms → 2.1 ms
The biggest single win. The pre-200 TB pipeline rebuilt 287 features per tick from raw history. The post-200 TB pipeline rebuilds 11, because the remaining 276 are pre-materialized in the hot feature store on NVMe+Redis. A feature lookup costs ~40 µs; a feature recomputation cost ~1.2 ms. We made 276 of them disappear.
Stage 3 — Neural Inference: 16 ms → 2.5 ms
Two changes. First, the production models were re-trained with INT8 quantization enabled and re-validated on the 200 TB historical set, which let us drop FP16 inference for 86% of strategies with no measurable accuracy loss. Second, we moved inference from a central cluster to GPU-equipped edge nodes co-located with exchange APIs.
Stage 4 — Risk & Slippage Filter: 6 ms → 0.9 ms
Per-venue slippage curves are now keyed lookups against the 200 TB store rather than Monte-Carlo simulations. The risk tensor is precomputed every 30 seconds in the background and pinned hot.
Stage 5 — Smart Order Router: 4 ms → 0.7 ms
Routing decisions used to involve calling out to a routing service. They now happen in-process, because the post-200 TB pipeline keeps the routing table — 200+ venues, fee tiers, latency profiles — in shared memory on each edge node.
Stage 6 — Exchange Acknowledgment: 3 ms → 0.5 ms
Moved from REST order placement to FIX 5.0 SP2 with persistent session pooling on venues that support it (Binance, OKX, Bybit, Coinbase Prime, BingX, and 14 others). For remaining venues, we use kept-alive WebSocket order channels with binary framing.
4. The Numbers: Full Benchmark Table
The table below is the May 2026 rolling-median dataset from our internal benchmark suite. The full CSV with P50/P95/P99 percentiles is downloadable at the bottom of this article.
| Pipeline Stage | Before | After | Δ | Primary Optimization |
|---|---|---|---|---|
| Market Data Ingest | 12.0 ms | 1.8 ms | −85.0% | DPDK kernel-bypass NICs |
| Feature Build | 14.0 ms | 2.1 ms | −85.0% | 200 TB hot feature store |
| Neural Inference | 16.0 ms | 2.5 ms | −84.4% | INT8 quantization + edge GPUs |
| Risk & Slippage Check | 6.0 ms | 0.9 ms | −85.0% | Pre-computed risk tensors |
| Order Send (SOR) | 4.0 ms | 0.7 ms | −82.5% | Co-located in-process router |
| Exchange Acknowledgment | 3.0 ms | 0.5 ms | −83.3% | FIX 5.0 SP2 + persistent sessions |
| TOTAL tick-to-trade | 55.0 ms | 8.5 ms | −84.5% | Stack-wide rewrite |
Trading outcomes that the latency reduction produced
| Metric | Before | After | Change |
|---|---|---|---|
| Server-side data storage | ≤ 1 TB | 200 TB | 200× |
| Exchanges monitored | 45 | 200+ | 4.4× |
| Arbitrage detections / min | 12 | 89 | 7.4× |
| Prediction accuracy | 72.0% | 94.7% | +22.7 pp |
| False-signal rejection | 78.0% | 98.7% | +20.7 pp |
| Opportunity capture rate | 14% | 78% | 5.6× |
| 90-day risk-adjusted ROI | 43.9% | 415.3% | 9.5× |
| Sharpe ratio | 1.2 | 3.8 | 3.2× |
| Max drawdown | −8.7% | −2.4% | −72.4% |
| Uptime SLA | 99.5% | 99.97% | +0.47 pp |
📊 Want the raw data?
Download the full CSV with per-stage P50/P95/P99 latencies and all headline KPIs —execution_stack_latency_benchmarks.csv
5. The Feedback Loop That 200 TB Unlocked
The most underappreciated consequence of the upgrade is the retraining loop. Before the upgrade, NeuralArB’s models retrained nightly on roughly 4–7 days of recent ticks. Anything older was sampled, summarized, or simply dropped because we didn’t have the storage to keep it hot.
With 200 TB hot + warm, every executed trade — fill, slippage, adverse selection — is written back into the same store the next inference will read from. The result is a closed loop where:
- A trade is executed in 8.5 ms.
- Its fill telemetry is in the feature store within 200 ms.
- Within 30 minutes, the affected (venue, pair) slippage tensor is rebuilt.
- Within 6 hours, the model checkpoint that consumes it is fine-tuned.
- Within 24 hours, the new checkpoint is canaried into production at the edge.
This loop is what drove the prediction-accuracy jump from 72% to 94.7%. The model is not fundamentally smarter — it is just fresher, and freshness compounds with low latency. Stale signals served fast are useless. Fresh signals served fast print money.
6. What This Means for You as a User
The technical detail is interesting; the practical impact is what matters. If you trade on NeuralArB today, three things changed:
1. You see opportunities you literally couldn’t see before
Detection rate went from 12/min to 89/min. Many of these are micro-arbs (sub-15 bps) that existed in 2025 but lived for 20–40 ms — under the old tick-to-trade we couldn’t act on them before they closed.
2. Your fills are more honest
False-signal rejection went from 78% to 98.7%. In practice this means fewer slippage surprises, fewer “the spread was there a moment ago” trades, and fewer toxic-flow fills from adversarial counterparties.
3. Drawdowns are smaller
Max 90-day drawdown moved from −8.7% to −2.4%. This is what most retail users actually care about — not headline ROI, but how much pain comes with it.
💡 Ready to Trade on the Faster Stack?
NeuralArB users get the post-200 TB execution stack by default — no configuration required. Start free, scale when ready.
7. What’s Next: 1 ms and the Hardware Frontier
8.5 ms is fast for software. It is not fast for hardware. The leading FPGA-based HFT shops operate at 200–400 nanoseconds tick-to-trade in trad-fi markets — roughly 25,000× faster than where we are today (Medium: FPGA Acceleration in HFT).
Our internal roadmap targets sub-2 ms median tick-to-trade by Q4 2026, driven by:
- FPGA orderbook parsing on the receive path (eliminates Stage 1 software cost).
- Ahead-of-time compiled inference to ASIC-class accelerators (Stage 3).
- Pre-signed order templates per venue (eliminates per-trade auth cost in Stage 5).
The 200 TB layer makes these viable: you can only confidently pre-compile a model for an accelerator if you have a deep, labelled, hot historical set to validate every quantization decision against. The execution stack and the data stack are not two systems — they are one system with two faces.
💬 Frequently Asked Questions (FAQ)
What does "latency is alpha" mean?
In modern crypto arbitrage, execution speed itself produces profit. A signal that arrives 30 ms late is, in most market conditions, already worthless. NeuralArB’s measurements show every millisecond above 10 ms tick-to-trade removes ~3–6% of capturable alpha.
How did NeuralArB cut latency from 55 ms to 8.5 ms?
A full execution-stack rewrite funded by the 200 TB upgrade: DPDK kernel-bypass NICs, a 200 TB hot feature store, INT8-quantized inference on edge GPUs, co-located smart order routing, and FIX 5.0 SP2 with persistent sessions. The combined effect is an 84.5% reduction across six pipeline stages.
Why does 200 TB of historical data matter for execution speed?
Because it lets us pre-compute work that used to happen at runtime. Slippage curves, risk tensors, and quantized neural weights are all materialized offline against the historical set, so the live execution path only does lookups. Per-stage latency dropped 80–85% even though compute per trade is similar.
Is sub-10 ms tick-to-trade necessary for retail arbitrage in 2026?
Yes — for cross-exchange and perp-DEX arbitrage. Major venues now publish orderbook updates every 5–10 ms and competing market-makers operate at 1–3 ms. A retail bot on a home VPS at 200–500 ms captures less than 10% of advertised spreads after slippage.
Why did prediction accuracy jump from 72% to 94.7%?
Two reasons. First, the model now consumes much fresher features — a 5 ms-old orderbook tells the truth in a way a 50 ms-old one does not. Second, the 200 TB historical set let us retrain on 100× more labelled examples, especially edge cases like flash crashes and venue outages.
Can users independently verify these numbers?
Yes. NeuralArB publishes the per-stage benchmark CSV (linked above) and a live status dashboard at neuralarb.com/markets/ showing rolling tick-to-trade percentiles by exchange.
Does this also apply to perp DEX arbitrage on Hyperliquid?
Yes — although on-chain confirmation adds a floor (~80–150 ms on Hyperliquid) that no execution stack can defeat. Our 8.5 ms still matters because it determines how long we have to decide before submitting. See our Hyperliquid vs CEXs comparison.
What's the practical impact on the average NeuralArB user?
More opportunities detected (12 → 89/min), more honest fills (98.7% vs 78% rejection of toxic signals), smaller drawdowns (−2.4% vs −8.7% max), and a higher 90-day risk-adjusted ROI (415.3% vs 43.9% in the live cohort).
What's next on the roadmap?
Sub-2 ms tick-to-trade by Q4 2026 via FPGA orderbook parsing, AOT-compiled inference to accelerators, and pre-signed order templates per venue.
Disclaimer: These materials are for general information purposes only and are not investment advice or a recommendation or solicitation to buy, sell or hold any cryptoasset or to engage in any specific trading strategy. Some crypto products and markets are unregulated, and you may not be protected by government compensation and/or regulatory protection schemes. The unpredictable nature of the cryptoasset markets can lead to loss of funds. Tax may be payable on any return and/or on any increase in the value of your cryptoassets and you should seek independent advice on your taxation position.
About this article. All benchmarks are NeuralArB Execution Lab internal measurements, May 2026 medians, across 200+ venues. Methodology, percentiles, and venue breakdown are available in the linked CSV.
Further reading on NeuralArB: NeuralArB Has Grown x200: How Server-Side Data Storage Reshaped the Platform · Perp DEX Arbitrage in 2026 · Free Arbitrage Bots vs. Paid AI Solutions